

including those in the Atlanta metro area. Defined by the United States Department of Agriculture (USDA) as access “at all times to enough food for an active, healthy life,”1 food security generally means that households consistently know where their next meal will come from. Food insecurity – a lack of such assurance – is primarily linked to poverty rates, but household level factors such as access to transportation and health problems can also play key roles.2 Nationally, the food insecurity rate in 2015 was measured at 12.7 percent, a figure that has remained stubbornly high,3 but food insecurity rates can be two or three times that figure for households with children (especially single mother households), as well as for African American and Hispanic households.4
Food insecurity is an issue worth addressing for multiple reasons. First, the “right to food”5 is a moral imperative in countries with the wealth and resources of the United States. The fact that more than one in ten Americans regularly go hungry is difficult to justify. Beyond that, food insecurity is linked to other adverse health outcomes: depression, developmental disorders, obesity, and other chronic conditions.6 The financial and social costs of these outcomes can compound the negative impact of segregation and high poverty rates in marginalized communities.
Though food insecurity is experienced at the household level, estimates of its prevalence are often at much broader scales. Official estimates at the national and state level are produced through data collected yearly by the US Census,7 and the national anti-hunger organization Feeding America has combined these with additional demographic data to produce county level estimates.8
While these county-level estimates are beneficial in showing regional patterns, they provide little guidance for interventions within metropolitan areas, where counties are often economically and socially diverse. In Atlanta, for example, Fulton County is marked by extremes: low poverty rates in the north but high poverty rates in the south. Considered as a whole, these two counterbalance each other. Feeding America estimates 18.5 percent of households are food insecure in Fulton County, above the national estimate but well below poor rural counties such as Hancock, Macon, and Terrell, all with rates near 25 percent.9 The lack of geographic precision in local estimates thus complicates efforts to plan for interventions in places where food insecurity is projected to increase.
With support from the Atlanta Community Food Bank, I and other researchers created census tract level estimates to address this issue with a specific focus on the Atlanta Metropolitan Statistical Area.10 To identify projected trends we created two sets of estimates: one using the most recent census data and the other based on population projections for the year 2020 using past trends as a predictor. We summarize three of our main findings below. Full results of our research are forthcoming in the journal Professional Geographer.
Our tract level estimates of food insecurity (figure 1) show high (>25 percent) food insecurity rates in southern Fulton and DeKalb counties as well as much of Clayton County – areas of the metro where residents are disproportionately low-income and people of color. Northern Fulton County has some of the lowest rates as well as neighboring Cherokee and Forsyth counties. Our estimates show that these areas of high or low food insecurity rates often span counties, as well as accentuating how widely rates can vary within a county. Both show the value of tract level over county level estimates.
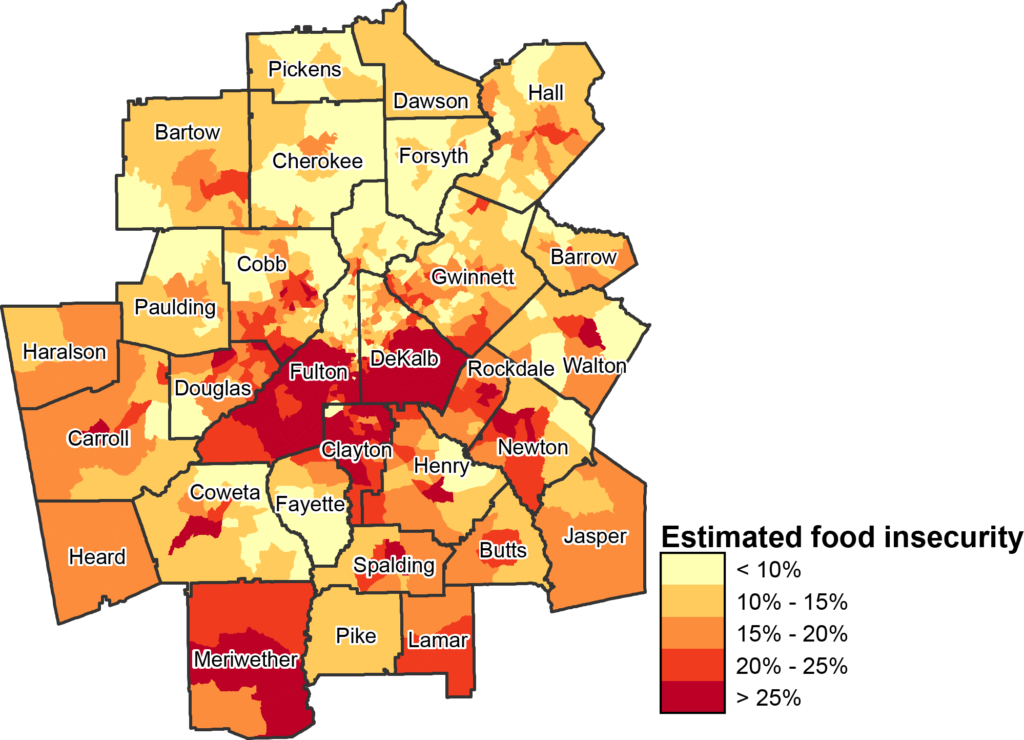
While food security is highest in the urban core, pockets of high food insecurity are also visible in some suburban counties, including Walton, Rockdale, Newton, Coweta, and Cobb. Again, these may have been less visible if data was estimated only at county level.
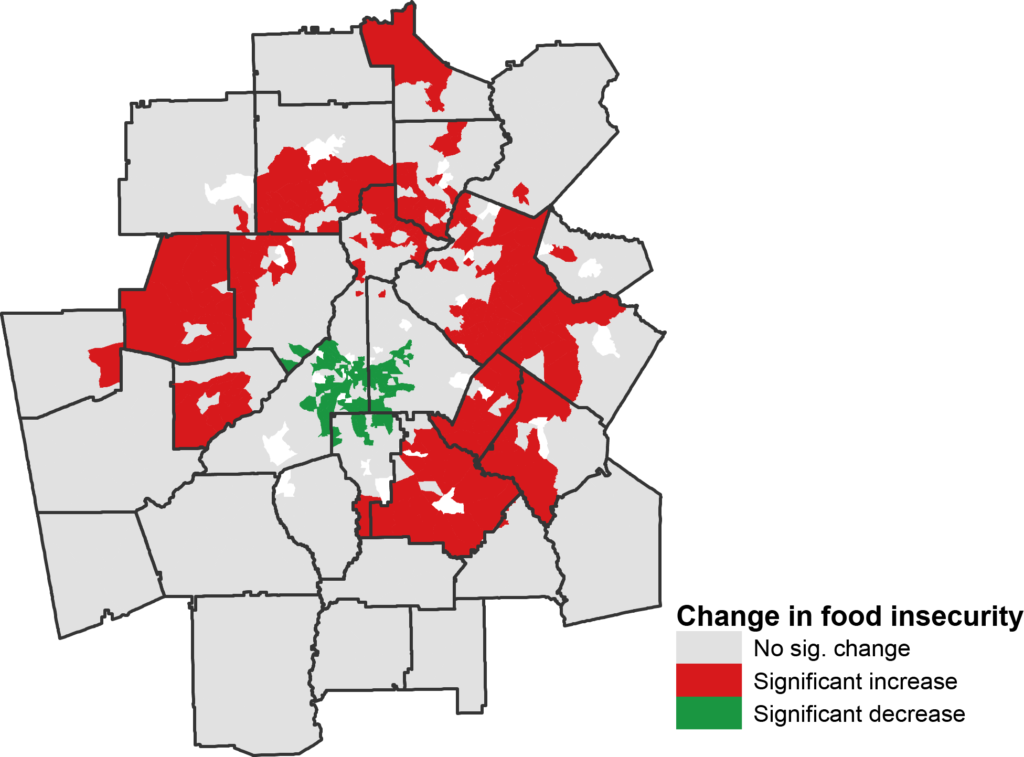
Furthermore, as figure 2 shows, our projected food insecurity rates in 2020 show that while the highest rates of food insecurity will still be in the urban core, rates in those areas will likely remain flat or even decline over the coming five-year period. Conversely, rates of food insecurity are projected to increase significantly in many outer suburbs, most noticeably in Paulding, Cherokee, Gwinnett, Walton, Rockdale, Newton, and Henry counties.
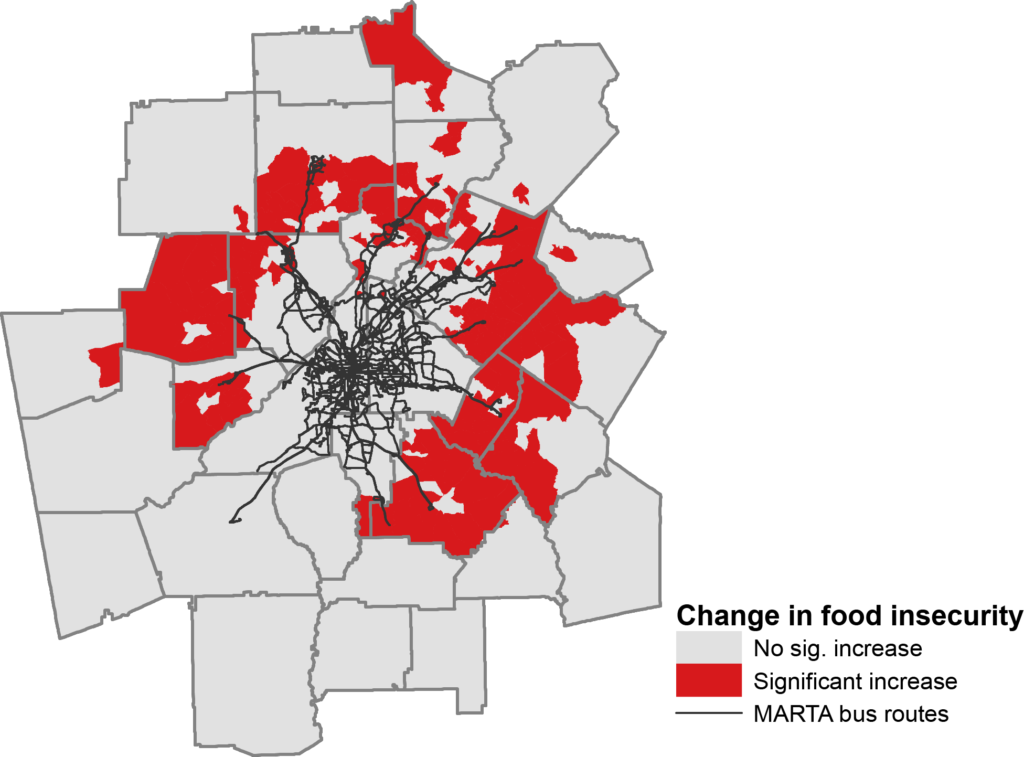
Lastly, we made a visual comparison between projected changes in food insecurity, transportation resources, and access to emergency food sites. Notably, as figure 3 shows, most areas with projected increases in food insecurity have few if any available bus lines. Moreover, our analysis showed these outer suburbs have noticeably fewer operating food pantries than in the urban core. For those without reliable vehicles, the landscape of these suburban communities may pose significant challenges, ranging from the effort of finding rides with family and friends to access food sources to the time cost of using limited bus service if available. Even for those with vehicles, gas and maintenance costs may pose a significant burden.
Atlanta has traditionally been a city of suburbs, with far fewer metropolitan residents in the city proper than other comparably sized cities. For suburban residents, local officials, and activists, rising food insecurity presents several challenges, but also the opportunity to pioneer new models in urban design, public transit, economic development, and food systems planning that cultivate healthier and more equitable communities.
Just as previous research has highlighted the rapid growth of poverty in the suburbs,11 our research demonstrates similar trends for food insecurity. Scott Allard’s Out of Reach, for example, documented how the lack of service centralization and scant transit options can compound challenges faced by low-income households in suburban communities.12 In Atlanta specifically, the often contentious politics surrounding MARTA expansion mean that increasingly food insecure households may have few good options for getting to and from food sources, balancing costs of vehicle ownership against the benefits of more accessible transportation. Advocacy for stronger public transit and walkable, mixed-use development may thus play a key role for anti-hunger activism in the suburbs. In addition, activism to lower food insecurity rates must also address shifts in labor patterns, such as the rise in service sector jobs and a stagnant minimum wage, all of which can lead to food insecurity for struggling households.
While these broad-scale changes in urban design and policy are difficult, other, smaller interventions can also address rising food insecurity rates in suburban areas. For example, the Atlanta Community Food Bank is currently engaged in strategic planning about models that can better serve suburban households Mobile food pantries, such as the one hosted by Covington First United Methodist Church, can provide improved access for families, as can pop up pantries at schools, parks, or even MARTA stations. Additionally, the sprawling nature of many suburban communities may provide opportunities for growth in local food systems – such as community gardens and small-scale agriculture – that can provide both economic and health benefits to suburban communities.
Our research shows how food insecurity remains a persistent and even growing problem in many of Atlanta’s communities, particularly those located within the city’s suburbs. Despite these challenges, the interventions outlined above show how anti-hunger activists and non-profits can continue working to ensure that all of the city’s households are free of hunger.
