Our neighborhoods have a big influence on all of us. In good ways and bad, neighborhoods impact both the immediate mental, physical, and economic well-being of adults and children, and can also “significantly affect a wide range of individual outcomes” over time for children (their educational success and future earnings as adults), teens (their involvement in criminal activity), and adults (their economic self-sufficiency and stability).1 Neighborhoods affect us in real-time, in ways that directly and immediately affect our well-being through factors like crime and pollution. Neighborhoods also shape our futures, through things like well or poorly resourced school districts, that translate over time into higher or lower graduate rates, higher or lower college admission and completion rates, and higher or lower lifetime earnings.2
Given the power of these short- and long-term “neighborhood effects,” understanding the geography of opportunity, or where the neighborhoods are that successfully springboard residents to upward mobility, is important. Even more important is understanding the degree to which these “high opportunity” neighborhoods are accessible to different groups—to renter households and owner households, to households of different income levels and racial backgrounds. This essay is particularly concerned with revealing to what degree owners and renters in general, and Black owners and renters in particular, have access to high-quality and high-opportunity neighborhoods in the Atlanta-Sandy Springs-Roswell, GA Metropolitan Statistical Area (MSA)3 (referred to throughout this paper as the “Atlanta MSA”) and how that access evolved over time.

Looking closely at neighborhood effects and opportunity in the Atlanta MSA is particularly revealing because of how the population is growing and spreading out. On the one hand, this “capital of the New South” and “capital city of black America” is now the 8th largest metropolitan statistical area in the country (up from 11th in 2000).4 The Atlanta MSA’s Black population grew four times over (from roughly 500,000 to 2.1 million) between 1980 and 2020 and is now second only to the Black population of the New York-Newark-Jersey City, NY-NJ-PA MSA. And today, there are more Black homeowners in the Atlanta MSA (404,699) and more Black suburbanites (1.8 million) than in any other MSA.5 This indicates the presence of a substantial Black middle class, and suggests the presence of several pathways to upward social, economic, and spatial mobility in the region.
On the other hand, poor children growing up in the Atlanta MSA have historically lagged behind those in other large MSAs when it comes to their eventual earnings as adults, and upward mobility for white children has tended to far exceed that for Black children.6 This is largely explained by the region’s high and persistent levels of residential segregation between white and Black residents.7 While various measures of residential segregation improved for the Atlanta MSA between 1980 and 1990, they have remained nearly unchanged in the decades since: in 1990, 2000, 2010, and 2020, analyses of Census data found that roughly 60% of the typical Black resident’s neighbors were also Black, and barely 30% of that typical Black resident’s neighbors were white.8 Researchers have found that high levels of residential segregation can negatively impact upward mobility and the economic outcomes (such as lifetime earnings) of lower-income youth.9
This article attempts to untangle these opposing forces, the pathways to upward mobility and the barriers to them, by looking at residential patterns and neighborhood opportunity in the Atlanta MSA. What have these pathways and barriers meant for local residents’ access to opportunity? How have, and how are, the region’s patterns of suburbanization, homeownership, and residential segregation overlapping with vital neighborhood amenities, conditions and resources? Where are the Atlanta MSA’s high-opportunity neighborhoods and who has lived in them? Answering these questions first requires understanding the spatial distribution of the region’s owner and rental housing units, and the region’s Black and white households, and then understanding how these distributions overlap with the kinds of neighborhood amenities that help contribute to residents’ well-being and upward mobility.
Zoning and the Distribution of Rental Housing and Neighborhood Opportunity
Nationally, rental housing is far from evenly distributed across different neighborhoods within metropolitan areas. Recent work on the prevalence of single-family zoning,10 the existence of “rental deserts,”11 and the segregation of rental housing bears this out.12 One force behind the uneven distribution of rental units is Euclidian, or use-based, zoning. This kind of local zoning ordinance almost universally includes a designation limiting development in certain zones to detached single-family housing. This housing type is far more likely to be owner-occupied than renter-occupied. In 2021, for example, while the national homeownership rate was 65%, the homeownership rate in detached single-family housing was 86%.13 Yet most land in many cities and regions is set aside for only these units, all but guaranteeing few rental options across large swaths of these metropolitan areas.14
This creates what the Joint Center for Housing Studies refers to as “rental deserts,” or neighborhoods in which less than 20% of all housing units are either currently renter-occupied or vacant but available to rent.15 Nearly one-third of the Census tracts in the nation’s metropolitan areas have consistently qualified as rental deserts: 30.4% did so in 1990 and 29.0% did in 2019. In the Atlanta MSA, fully 36.1% of Census tracts qualified as “rental deserts” in 1990. While this percentage has fallen and is now in-line with MSAs nationwide (30.2% of the Atlanta MSA’s tracts were “rental deserts” in 2019), these neighborhoods, as a group, account for nearly half (45%) of the Atlanta MSA’s land area and collectively house 42% of the region’ s owner households but just one-tenth (10.2%) of area renters (See Figure 1).

Figure 1: The Location of “Rental Deserts” in the Atlanta MSA in 1990 and 2019
In Cherokee, Coweta, Fayette and Forsyth counties, between 70% and 80% of land area is rental deserts; just 2% of the region’s renters live in these counties.16
This kind of exclusionary zoning lets residents of single-family-only neighborhoods “amass disproportionate property wealth” and “enjoy the best public services, environmental quality, and private, public, and natural amenities.”17 Residents of these “favored” neighborhoods then tend to “opportunity hoard,” or maintain their own advantage, by continuing to restrict what kind of housing can be built in their neighborhoods through development restrictions that they typically have the political clout to heavily influence.18
The concentration of wealth, resources, and amenities in these neighborhoods comes at the expense of all other neighborhoods. If opportunities are “hoarded” in some areas, they are notably absent, or at least in far shorter supply, in other places. Neighborhoods with lower-quality services and fewer amenities are often those providing more than their share of rental housing to make up for the lack of it in rental deserts. As a result, exclusionary zoning can prove detrimental to renters’ access to opportunity and their children’s upward mobility.19
The separation of rental desert and areas with high concentrations of rentals also overlaps with and reinforces other forms of separation, including the segregation of households based on income. “Since 1970, income inequality among neighborhoods has increased more rapidly than income inequality among households.”20 How much or how little for-sale and for-rent units are integrated into the same neighborhoods, and how much or how little units at different price points are integrated into the same neighborhoods, dictates how many or how few households at different income levels are integrated into the same neighborhoods. Zoning ordinances that limit what types of housing can be built, and that restrict the variety of any given type of housing (through minimum lot or setback requirements, for example) can reinforce or worsen patterns of economic segregation.21
Exclusionary zoning has also contributed to racial segregation between Black and white residents, something that remains common across U.S. metropolitan statistical areas, particularly in the Northeast and Midwest.22 The severity of residential segregation is typically quantified using a Dissimilarity Index. The index, measured for any two groups, highlights what percentage of one group would need to be (hypothetically) moved to another neighborhood so that all neighborhoods would have the same breakdown of the two groups as the region as a whole. While the Dissimilarity Index for Black and white households and other measures of Black-white separation have declined since 1980, progress has been notably slow, and the level of Black-white segregation remains high.23
High and stubborn levels of Black-white segregation is certainly the case in the Atlanta MSA. The MSA had a Black-White Dissimilarity Index of 77 in 1980. (Any index value over 60 is considered “high,” meaning the two groups comprising the measure are substantially separated from one another.) While the MSA’s index had fallen to 63 by 2000, it has hovered at that level in the decades since. In 2020, the Atlanta MSA’s Black-White Dissimilarity Index was 59, right at that cut-off for levels recognized as “high.”24 As a result, the average Black resident in the region lives in “very different neighborhood environments” than the typical white resident, much like the situation in MSAs across the country.25
Discrimination against non-white households in the housing market, particularly against Black renters and buyers, is a significant source of the “staggering” racial inequality in the housing market.26 “Existing scholarship notes material racial disparities in housing access, housing quality and neighbourhood conditions.”27 Discriminatory practices by rental agents and landlords help create worse outcomes in terms of housing and neighborhood quality for Black renters in particular.28 These dynamics also reinforce patterns of residential segregation, as rental agents are more likely to withhold advertised units from non-white apartment hunters in largely white neighborhoods, effectively steering minority renters into diverse neighborhoods.29 Similar practices exist among Realtors brokering for-sale housing. Housing audits (which pair teams of equally qualified potential buyers requesting similar properties, one white and one Black, to document any difference in treatment between the two) conducted in Atlanta in the 1990s, for example, found that Black auditors had a “statistically significant probability of being shown or recommended neighborhoods with lower percentage white” than their white counterparts.30
Racial discrimination in the housing market not only means that Black households have less access to amenity- and opportunity-rich neighborhoods than white households do, but these neighborhood disparities then fuel “significant black-white gaps in intergenerational mobility.”31 In this way, neighborhood effects and patterns of residential segregation “drive persistent racial inequity in economic opportunity.”32 The “resources, institutions, and socializing agents” in neighborhoods, as well as the condition of neighborhoods’ natural and built environments, influence “the welfare and life chances of their residents.”33 The mix of amenities, connections, and conditions across different neighborhoods create a “geography of opportunity.”34 How the distributions of rental housing or lower-cost units or households of different races overlap with this geography determines how accessible opportunity and upward mobility are to renters, lower-income households, and non-white residents.
Measuring “Opportunity”
What does this geography of opportunity look like in the Atlanta MSA? Given the area’s ongoing population growth, suburban expansion, substantial Black middle class and large cohort of Black homeowners, who has had access to high-opportunity neighborhoods and how has this changed over time? How well do the places that different groups live, particularly Black owners and renters, facilitate residents’ upward mobility or the upward mobility of residents’ children? How common is rental housing in the region’s high-opportunity neighborhoods? [KP1]
Answering these questions requires first understanding neighborhood “opportunity,” or the neighborhood characteristics and features that best boost residents up the socioeconomic ladder, are. “High opportunity” neighborhoods include 1) those areas that have proven more successful at connecting residents with economic mobility, or 2) those neighborhoods with features likely to create the best short- and long-term outcomes for residents. While straightforward in theory, specifically quantifying a Census tract’s level of “opportunity” can be tricky. On the one hand, researchers have found several examples of neighborhood conditions, features and resources that could create or encourage “opportunity.”35 These include school quality, environmental quality, housing quality, levels of crime and economic opportunity, proximity to public transit access, and neighborhood walkability.36 On the other hand, less is known about the relative importance of these elements, which is the most powerful, or how much of each one is necessary to result in robust positive outcomes for area residents in the short and long term.37 As a result, “opportunity” is fairly difficult “to operationalize, let alone measure.”38
Given these challenges, Opportunity Insights’ Census tract-level estimates of resident children’s eventual earnings as adults becomes a particularly useful measure of “opportunity.”39 These estimates provide an “observational” measure of “neighborhood effects” on children growing up in low-income families in each Census tract. By studying the actual outcomes for children (born between 1978 and 1983) as they reached their thirties, this research sidesteps “the need to determine which predictors provide the most useful proxies” for opportunity.40 Specifically, Opportunity Insights’ “Mean household income rank for children whose parents were at the 25th percentile of the national income distribution,” when those children were between the ages of 31 and 37, represents low-income children’s relative incomes as adults, or degree of upward mobility, something their neighborhoods at least partially influenced (either positively or negatively). While this approach will not allow us to judge which factors played a greater or lesser role, it does summarize how well neighborhoods’ collection of resources and amenities, at the time this population was growing up, did overall at supporting upward mobility.
Collecting this indicator for all Census tracts, using it to generate “average opportunity scores” for all MSAs (simply the average value among Census tracts within each MSA), and then using both to calculate an individual Census tract’s “Opportunity Score” (how the tract’s value compared to the MSA’s average) made it possible to classify Census tracts as having well-below-average (more than 1.0 standard deviations below the MSA average), below-average (0.5 to 0.99 standard deviations below the MSA average), average (0.49 standard deviations below to 0.49 standard deviations above the MSA average), above-average (0.5 to 0.99 standard deviations above the MSA average) or well-above-average (more than 1.0 standard deviation above the MSA average) opportunity. In the Atlanta MSA, roughly one-third (34%) of Census tracts had below- or well-below-average “opportunity,” just over one-third (37%) had average opportunity, and just under one-third (29%) had above- or well-above-average opportunity.
The Opportunity Insights’ measure does have some shortcomings.41 The indicator is somewhat weakened by the fact that it reflects potentially outdated information about neighborhoods. Neighborhood conditions in the 1980s and 1990s impacted the study’s sample of children. Because these children’s outcomes reflect (at least in part) neighborhood “opportunity” as of the 1980s and 1990s, it is best at showing which households had access to high- or low-opportunity neighborhoods, and what kinds of housing units were located in high- or low-opportunity neighborhoods, in 1990.
Opportunity Insights’ estimates, though, do remain “informative (albeit imperfect) predictors of economic opportunity even for children today.”42 Further analysis by that team found that the power of their indicator “in forecasting outcomes for future birth cohorts decays by only 10% over a decade” and, even with this slippage, their indicator remained a better predictor “of more recent outcomes than contemporaneous observables.”43 Due to the indicator’s enduring explanatory power, it is possible to assess current access into high-opportunity neighborhoods, and how the populations and housing stocks of both high- and low-opportunity neighborhoods have changed since 1990.
The Accessibility of Opportunity in the 1990s
Have high-opportunity areas become more accessible to a larger number of lower-income households, diverse households, or renters over time? Or are Opportunity Insights’ best-performing neighborhoods still just as out-of-reach as they were in 1990? How do conditions and trends in the Atlanta MSA compare with those in comparable regions?[KP2]
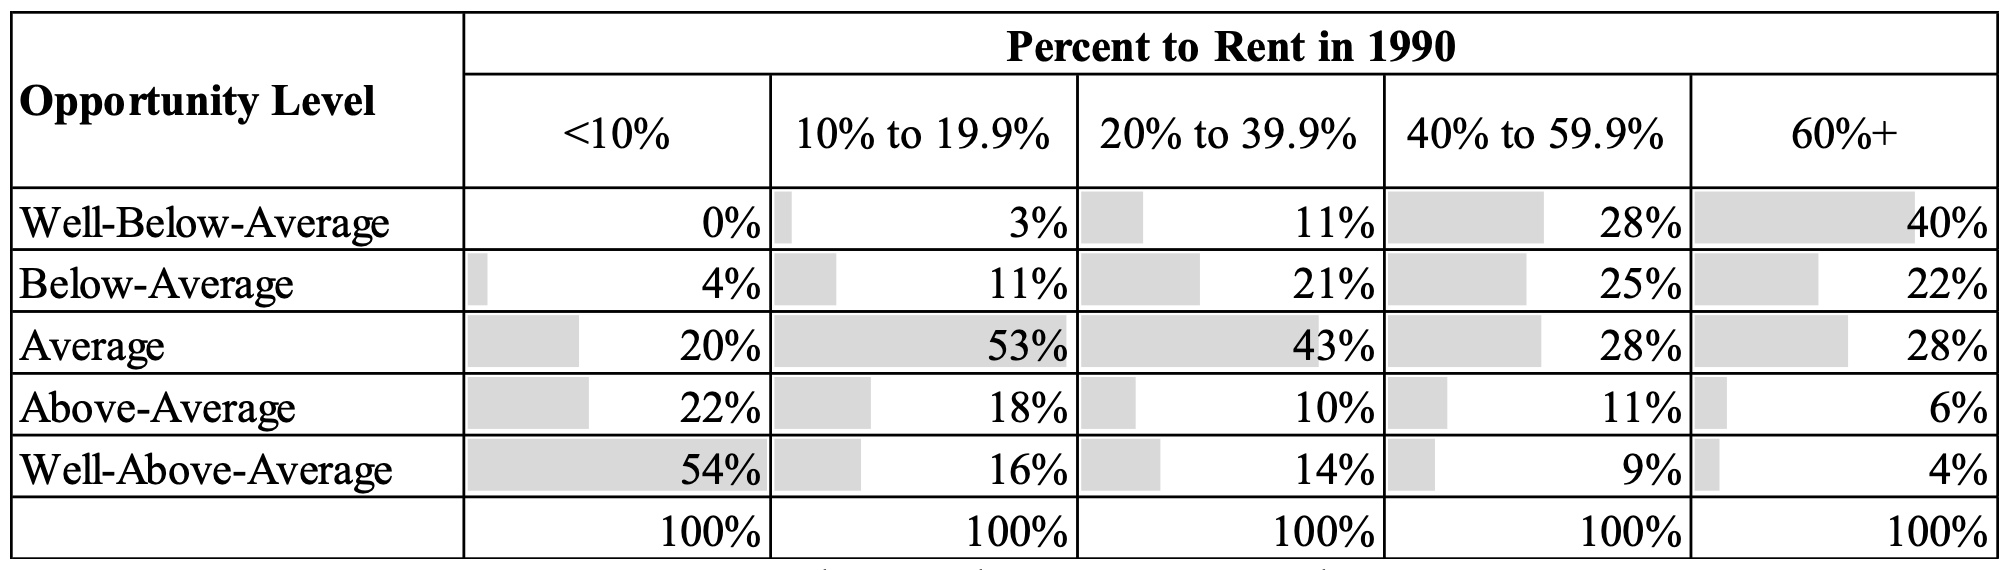
Across all MSAs nationwide, the overlap between high-opportunity and high-rental neighborhoods was distressingly small in 1990: 59% of all neighborhoods with the highest concentrations of units available to rent that year had below-average or well-below-average opportunity scores (scores that were more than 0.5 standard deviations below their MSA’s average score), while a similar portion (62%) of all neighborhoods with the lowest concentrations of units to rent had above-average or well-above-average opportunity scores (scores that were at least 0.5 standard deviations above their MSA’s average score). In the Atlanta MSA, these disparities were even more pronounced: 62% of neighborhoods with the highest concentrations of rentals (at least 60% of units available to rent) in 1990 had below-average or well-below-average opportunity scores, while three-quarters (76%) of local neighborhoods with the smallest share of rentals (less than 10% of units available to rent) had above-average or well-above-average opportunity scores (See Table 1).
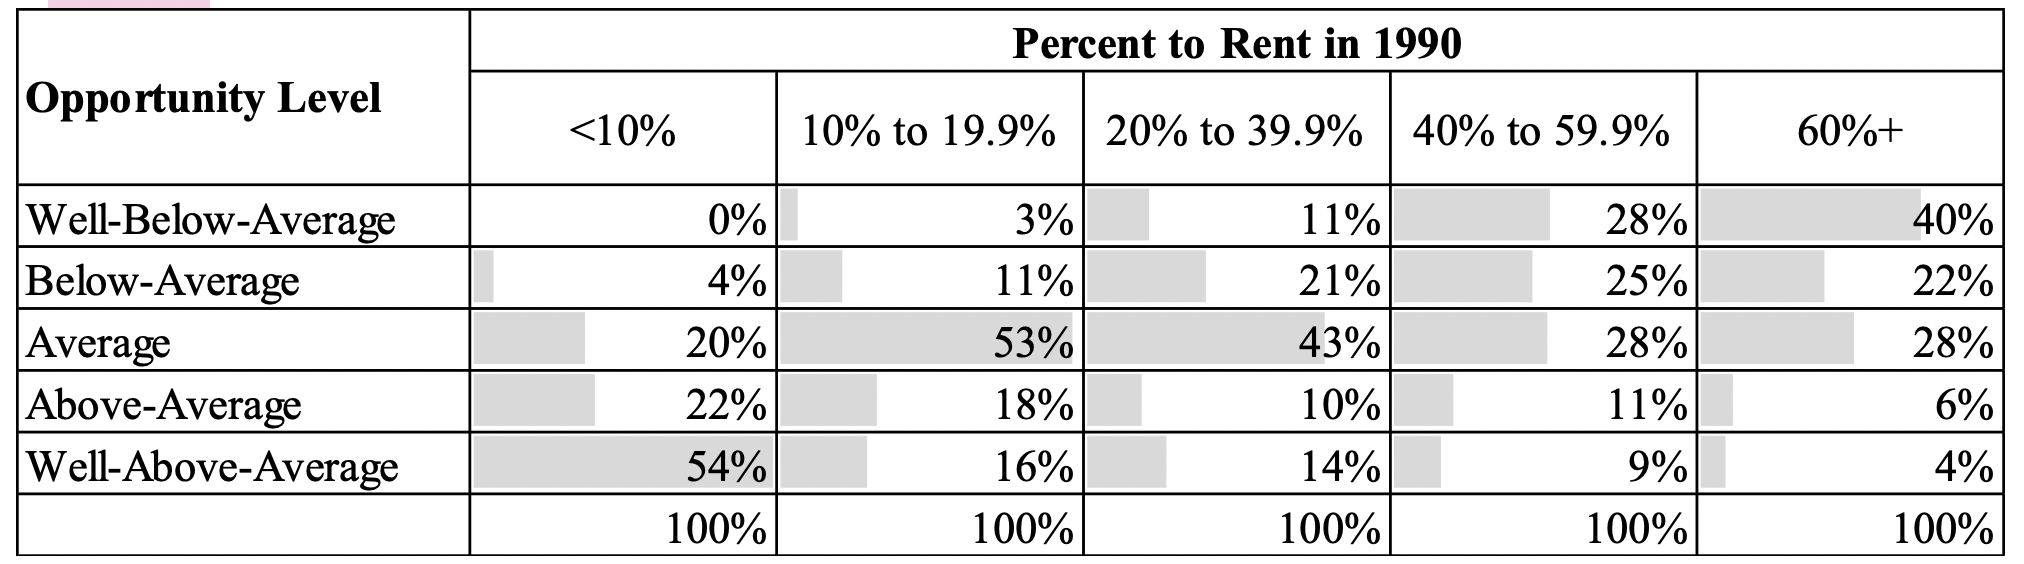
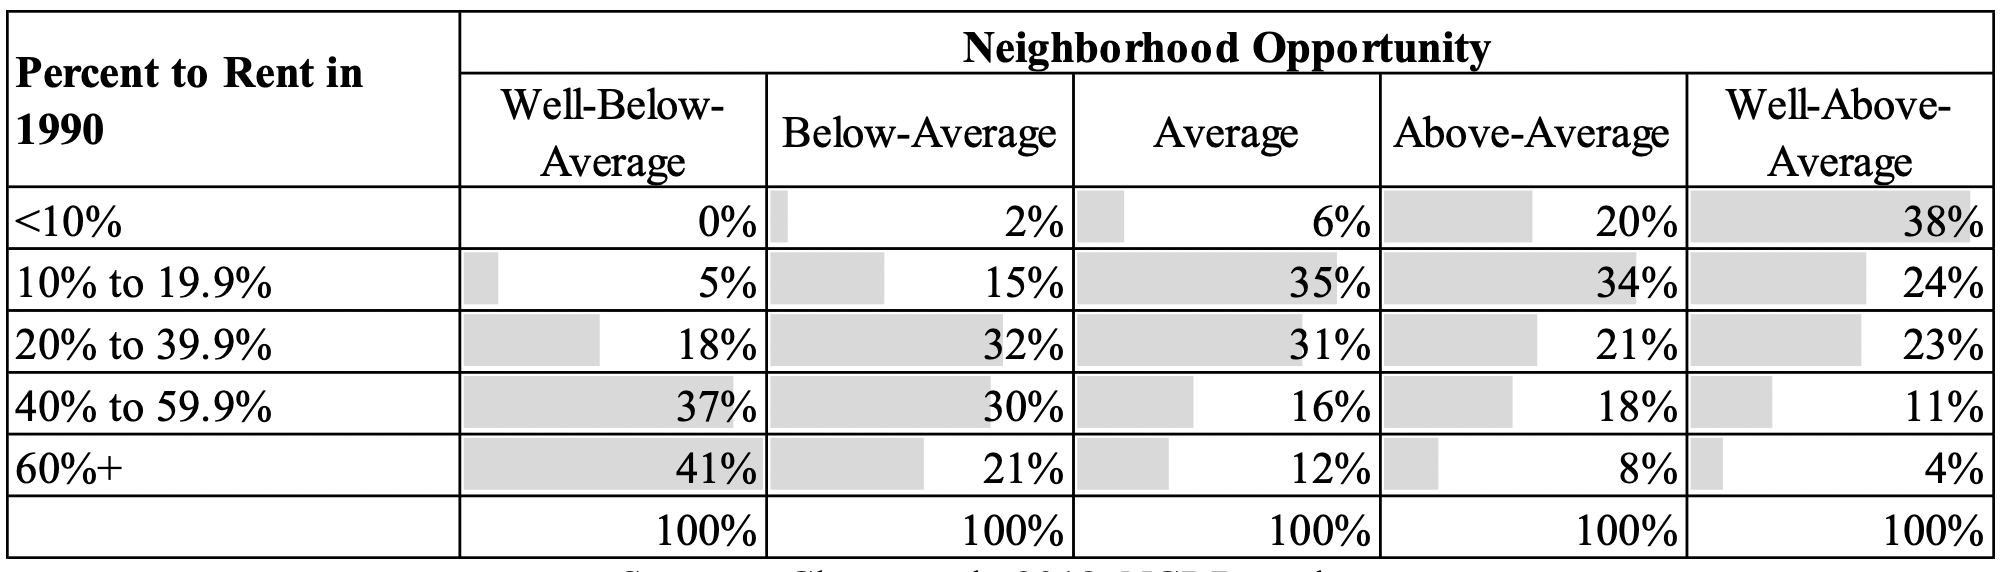
Looking at the same data from the other direction, across all MSAs over half (52%) of neighborhoods with well-above-average opportunity were rental deserts in 1990. Once again, figures for the Atlanta MSA were even more extreme: Nearly two-thirds (62%) of well-above-average opportunity tracts in the region were rental deserts in 1990. At the same time, the vast majority (78%) of well-below-average opportunity tracts had higher concentrations of rentals (at least 40% of units were available to rent) (See Table 2).
Because rental units were more common in lower-opportunity neighborhoods, renter households were as well. In 1990, 42% of all renters in MSAs across the country lived in well-below-average (23%) or below-average (19%) opportunity neighborhoods. That year, owners outnumbered renters more than two-to-one in above-average opportunity neighborhoods (the owner-to-renter ratio in these neighborhoods was 2.48) and by three-to-one in well-above-average opportunity neighborhoods (where the owner-to-renter ratio was 3.02). Yet again, Atlanta MSA figures were even more extreme: about half (49%) of the area renters lived in less-than-average opportunity neighborhoods in 1990, and in the Atlanta MSA’s well-above-average opportunity tracts, there were 3.5 owner households for every renter household (See Table 3).
| Opportunity Level | Owners (1990) | Renters (1990) | Owner-to-Renter Ratio | ||
| Well-Below-Average | 91,216 | 13% | 108,546 | 26% | 0.84 |
| Below-Average | 132,130 | 18% | 97,253 | 23% | 1.36 |
| Average | 269,919 | 37% | 134,812 | 32% | 2.00 |
| Above-Average | 93,632 | 13% | 41,162 | 10% | 2.27 |
| Well-Above-Average | 136,219 | 19% | 38,913 | 9% | 3.50 |
To a certain degree, these concentrations reflect differences in the distribution of owners’ and renters’ incomes. In 1990, the vast majority (81%) of owner households living in the nation’s MSAs had incomes over $20,000 (equivalent to roughly $39,000 in 2019 dollars) while just half (53%) of renter households did; one-fourth (24%) of renters had incomes below $10,000 in 1990 (equivalent to approximately $19,500 in 2019) compared to only 8% of owners. Still, the neighborhood breakdown, in terms of opportunity, for the lowest-income owners (those with incomes below $10,000) was the same as the neighborhood breakdown for moderate-income renters (those with incomes between $10,000 and $19,999); the breakdown for moderate-income owners was the same as it was for higher-income renters (those with incomes of $20,000 or more). It was low-income renters who were especially concentrated in lower-opportunity neighborhoods: 36% of renters with incomes below $10,000 in 1990 lived in well-below-average opportunity neighborhoods compared to just 23% of the lowest income owners. In the Atlanta MSA, nearly half (45%) of low-income renters lived in well-below-average opportunity neighborhoods in 1990 while just 29% of low-income owners did so. The region’s moderate-income renters were more concentrated in well-below-average opportunity neighborhoods than low-income owners (See Table 4).
Far greater than disparities in neighborhood opportunity levels by household tenure or even income, though, were disparities by race. In 1990, across all MSAs, over half of both Black owner households (56%) and Black renter households (59%) lived in the lowest-opportunity neighborhoods, and just 7% of Black owners and only 5% of Black renters lived in above- and well-above-average opportunity tracts. The experience of white households was nearly the reverse: just 7% of white owners lived in the lowest-opportunity neighborhoods, as did only 13% of white renters. In the Atlanta MSA, over half of Black owners (54%) and Black renters (56%) lived in well-below-average opportunity neighborhoods in 1990, and only one out of twenty Black renters (4%) and owners (5%) lived in higher-than-average opportunity neighborhoods. The opposite was true among the Atlanta MSA’s white households: just 8% of white renters and 5% of white owners lived in the region’s well-below-average opportunity neighborhoods in 1990, while 28% of white renters and 37% of white owners lived in higher-than-average opportunity tracts that year (See Table 5).

In other words, Black renters were seven times more like than white renters, and Black owners were nearly eleven times more like than white owners, to live in one of the Atlanta MSA’s well-below-average opportunity neighborhoods in 1990.
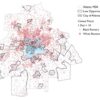
Truly, in the Atlanta MSA (as elsewhere), Black and white households, whether renters or owners, experienced very different neighborhoods in 1990. In the following maps, the dots represent renters (See Figure 2) and owners (See Figure 3) of different races, and “low opportunity areas” (those Census tracts classified as having either well-below-average opportunity or below-average opportunity) are outlined in black. As Figures 2 and 3 show, the region’s white renters and owners were spread out, while Black renters and owners were largely concentrated in the region’s low opportunity areas in 1990.


Among renters, these disparate patterns of concentration in the region’s lowest-opportunity neighborhoods (for Black households) and dispersal into higher-opportunity areas (for white households) held for Black and white renters with the lowest rents, and Black and white renters with the lowest incomes. In all cases, white renters were far less concentrated in low-opportunity areas. For example, in the Atlanta MSA, just 17% of white renters with gross rents below $300 in 1990 (equivalent to about $585 in 2019) lived in the lowest opportunity neighborhoods while two-fifths (41%) lived in average opportunity neighborhoods and 15% lived in above- and well-above-average opportunity neighborhoods. In contrast, the vast majority (73%) of Black renters with gross rents below $300 in 1990 lived in well-below-average opportunity neighborhoods and less than 1% lived in higher-than-average opportunity neighborhoods (See Table 6).

Similarly, nearly half (45%) of all white households with incomes below $25,00044 lived in average opportunity neighborhoods, and almost one-fourth (22%) lived in higher-than-average opportunity neighborhoods. Among Black households with incomes below $25,000, three-in-five (61%) lived in well-below-average opportunity neighborhoods, and only 4% lived in higher-than-average opportunity neighborhoods (See Table 6). In higher-than-average opportunity neighborhoods, there were 12 white low-income households for every Black low-income household (See Table 6). In other words, low-income Black households were far more likely than low-income white households to be concentrated in lower-opportunity neighborhoods, and almost no low-income Black households lived in higher-opportunity areas, in the Atlanta MSA in 1990.
One consequence of these disparities: most Black children, across all MSAs and in the Atlanta MSA in particular, were living in less-than-average opportunity neighborhoods in 1990. That year, in the Atlanta MSA, over half (56%) of all Black children (compared to just 4% of white children) lived in well-below-average opportunity neighborhoods and another 26% lived in below-average opportunity neighborhoods; just 3% (compared to 37% of white children) lived in above- or well-above-average opportunity tracts (See Table 7).
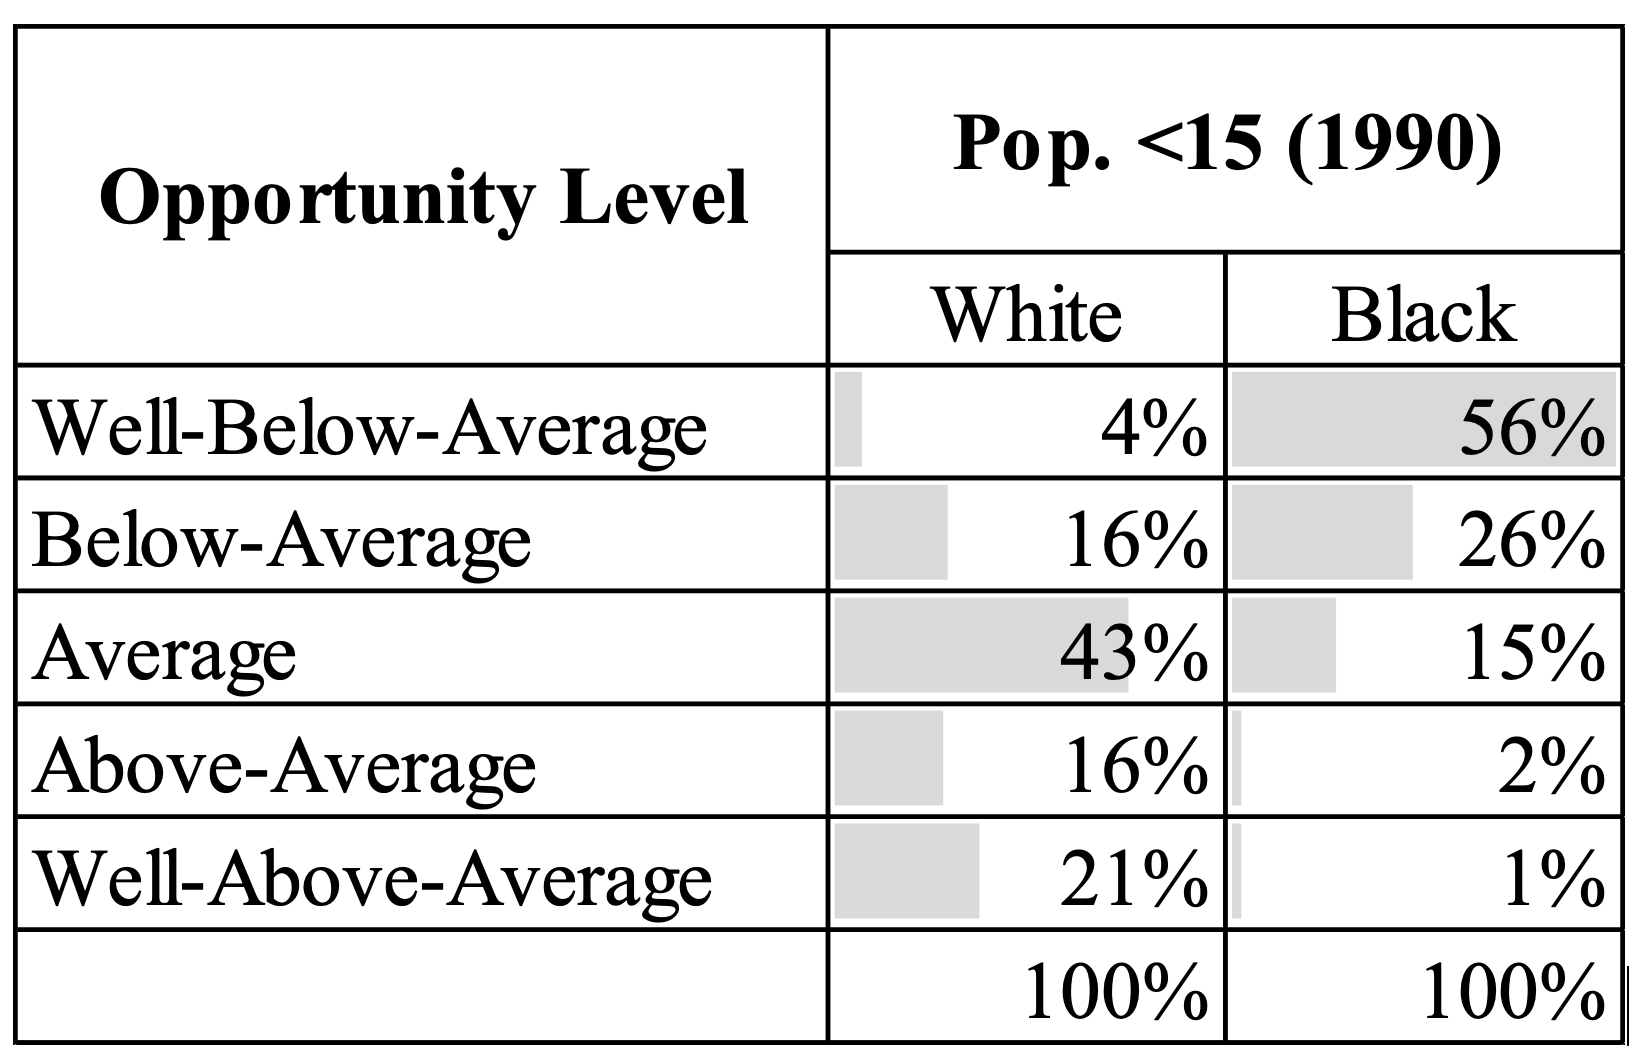
As the table shows, in 1990, white and Black children living in the Atlanta MSA experienced wildly different neighborhood experiences, with high-opportunity areas being the norm for white children and low-opportunity areas being the norm for Black children.
These figures demonstrate the high concentration of rental housing in lower-opportunity neighborhoods, the even higher concentration of low-cost rentals and lower-income renters in lower opportunity neighborhoods, and the still higher concentration of Black households, particularly Black renters, and Black children in lower-opportunity neighborhoods in 1990.
Shifts in Opportunity and Access to it between 1990 and 2019
What has happened in the decades since? Have metropolitan statistical areas in general, and the Atlanta MSA in particular, better integrated rental housing and lower-income and Black households and children into higher opportunity neighborhoods? [KP3] Overall, the concentration of rental housing in Opportunity Insights’ low- and high-opportunity neighborhoods was largely unchanged between 1990 and 2019. By 2019, rentals and specifically lower-cost rentals were far more plentiful in low-opportunity neighborhoods (those either below- or well-below-average) than in high-opportunity neighborhoods. Across all MSAs, there were nearly three (2.8) units with gross rents below $1,000, and three-and-a-half (3.6) units with gross rents below $700, in low opportunity neighborhoods for every unit with similar rents in high opportunity neighborhoods (those with either above- or well-above-average opportunity). In the Atlanta MSA, these ratios were twice as high: 6-to-1 for units with rents below $1,000 and nearly 8-to-1 for units with rents below $700 (See Table 8). The vast majority (61%) of the region’s most affordable rental units were in low-opportunity neighborhoods.
| Opportunity Level | All Rentals | Gross Rent (2019) | |||
| <$700 | <$1,000 | ||||
| Low (Below and Well Below Avg.) | 319,933 | 46,953 | 61% | 146,354 | 58% |
| Average | 280,808 | 24,040 | 31% | 81,694 | 32% |
| High (Above and Well Above Avg.) | 172,368 | 6,109 | 8% | 24,540 | 10% |
| Low-to-High | 1.9 | 7.7 | 6.0 | ||
| ACS 5-Year Estimates; author. | |||||
One positive change between 1990 and 2019, though, was the degree to which Black households in the Atlanta MSA, particularly Black renters, deconcentrated out of well-below-average opportunity neighborhoods. Between 1990 and 2019, the percentage of Black renters in well-below-average opportunity tracts fell from 56% to just 30%. This share of Black renters in the lowest-opportunity tracts, at 30%, was substantially lower than the equivalent percentage across all MSAs in 2019 (39%), a notable difference. Also, between 1990 and 2019, the portion of Black renters in the Atlanta MSA’s average opportunity neighborhoods nearly doubled (from 16% to 28%); and the portion in above- and well-above-average opportunity neighborhoods nearly tripled (from 5% to 13%) (See Table 9).

Still, the percentage of Black renters in well-below-average opportunity tracts in the Atlanta MSA in 2019 remained far higher than the percentage white renters in such tracts (30% for Black renters versus just 8% for white renters) in 2019.
Among Black owners in the Atlanta MSA, the shift out of low-opportunity areas was even more pronounced: while over half (54%) of Black owners were in well-below-average opportunity neighborhoods in 1990, this was true of just 20% by 2019. The percentage of Black owners living in average opportunity neighborhoods more than doubled from 15% to 35%, and the percentage in above- and well-above-average opportunity neighborhoods quadrupled from 4% to 16% (See Table 10).

These shifts were especially noteworthy given what the equivalent shifts looked like in similar MSAs, with large Black populations and high levels of Black-white segregation. In the Chicago, New York, Philadelphia and Washington DC MSAs,45 Black and white households occupied almost entirely different neighborhoods in 1990, with the vast majority of Black renters and owners living in below- or well-below-average opportunity neighborhoods that year, similar to conditions in the Atlanta MSA at that time. However, nearly thirty years later, when just 30% of the Atlanta MSA’s Black renters remained in low-opportunity areas, over half of Black renters lived in below- and well-below-average opportunity areas in the Chicago, New York and Philadelphia MSAs, and 41% did so in the Washington, DC MSA (See Figure 4).

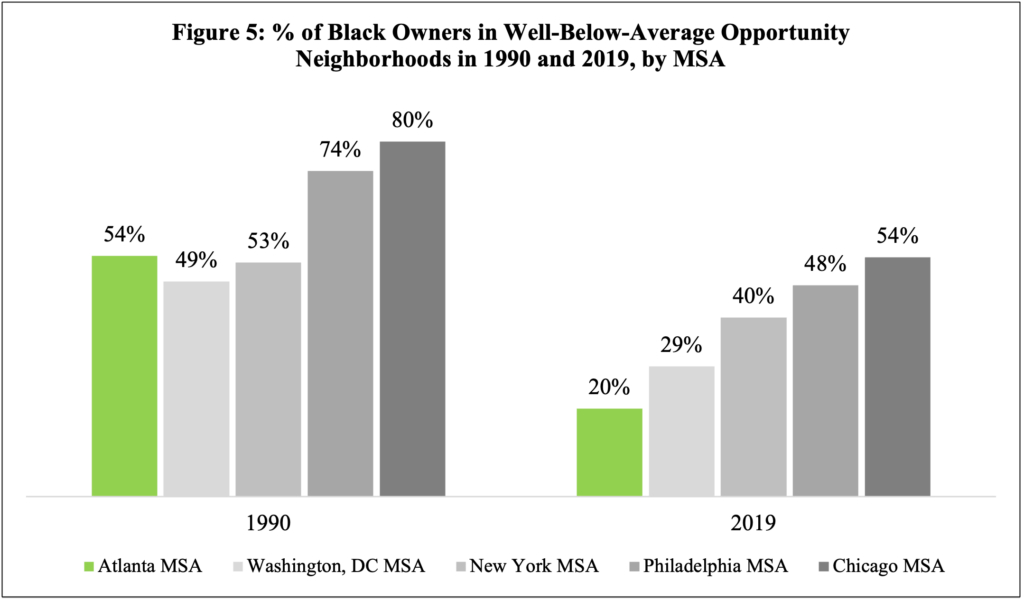
Similarly, by 2019, when only 20% of Black owners in the Atlanta MSA lived in well-below-average opportunity neighborhoods, the comparable share was 29% in the Washington, DC MSA, fully double that (40%) in the New York MSA, and more than double that in the Philadelphia (48%) and Chicago (54%) MSAs (See Figure 5).
Maps showing the dispersal of Black owners and renters between 1990 and 2019 really highlight exactly how much these households spread out into new neighborhoods in the Atlanta MSA. Over this time period, the region’s Black owners and renters moved in large numbers from the city itself to suburban areas, and beyond the boundaries of low opportunity areas. In sharp contrast, Black owners and renters moved to a lesser degree in the Washington, DC MSA, and to a far lesser degree in the Chicago, New York and Philadelphia MSAs (See Figures 6 and 7).

Figure 6: Black Renters Relative to Low Opportunity Areas, 1990 and 2019
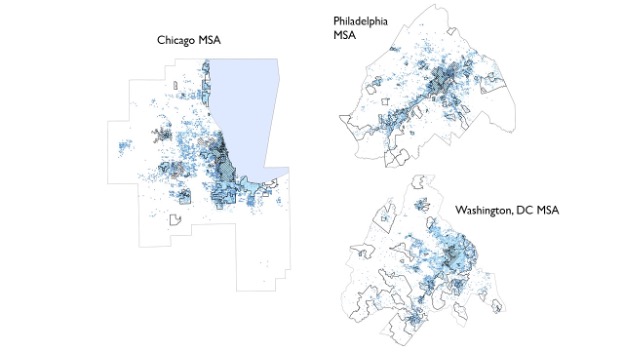

Figure 7: Black Owners Relative to Low Opportunity Areas, 1990 and 2019
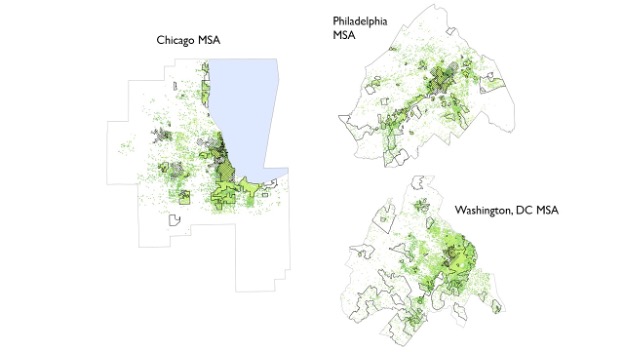
Black migration into areas with higher levels of opportunity between 1990 and 2019 occurred far more in the Atlanta MSA than in these comparable MSAs.
In addition, the improvements in neighborhood opportunity between 1990 to 2019 held for lower-income Black households in the Atlanta MSA: while 61% of Black households with incomes below $25,000 lived in well-below-average opportunity neighborhoods in 1990, by 2019, just 34% of Black households with incomes below $50,000 (a comparable level adjusting for inflation) did so. While the percentage of low-income Black households in well-below-average tracts was halved, the portion in average opportunity areas doubled (from 14% to 26%), and the portion in above- and well-above-average opportunity areas increased from 4% to 10% (See Table 11).

the Atlanta MSA, 1990 and 2019. Chetty et al., 2018; NCDB; 2019 ACS 5-Year Estimates. Table courtesy of author.
Lower-income Black households, though, still remained far more likely than lower-income white households to live in lower-opportunity neighborhoods: 65% of lower-income Black households lived in lower opportunity areas in 2019, compared to just 21% of lower-income white households. Thus, while opportunity improvements occurred between 1990 and 2019, Black households remained disproportionately represented in low opportunity neighborhoods.
These stubborn disparities mean that Black children under 15 are still far more likely to live in below-average or well-below-average opportunity neighborhoods than white children. In the Atlanta MSA, just over half (52%) of Black children under 15 lived in below- or well-below-average opportunity areas in 2019 compared to only 14% of white children under 15. While less than one-quarter (23%) of Black children lived in the lowest opportunity neighborhoods by 2019, down from over half (56%) in 1990, this was still far above the mere 3% of white children under 15 who lived in one of the region’s well-below-average opportunity neighborhood in 2019 (See Table 12).
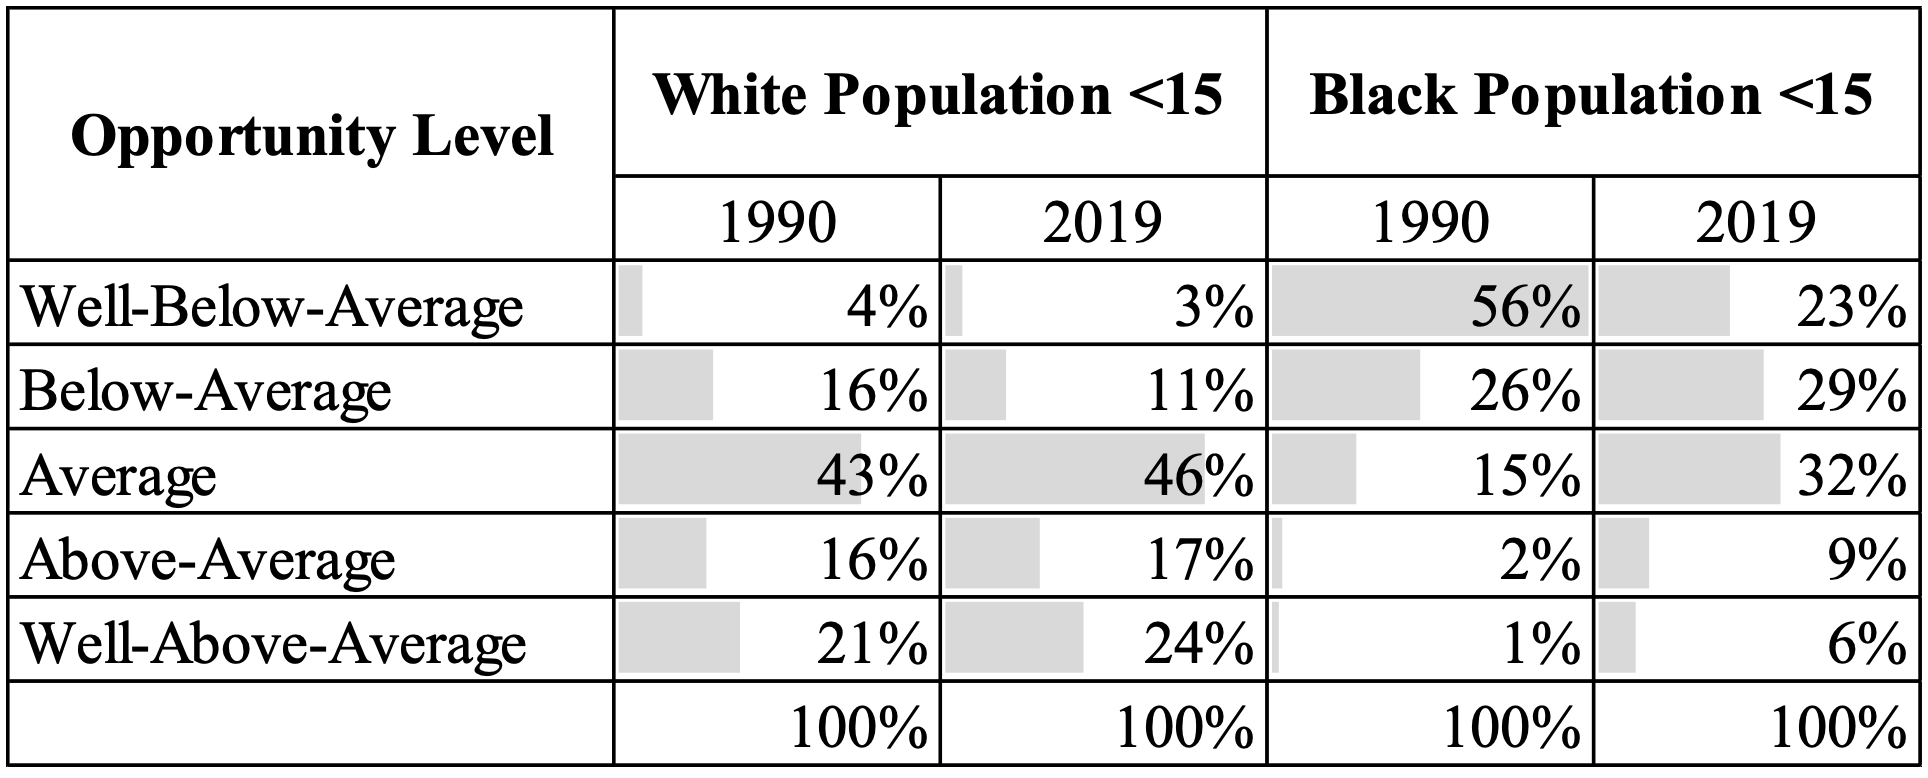
At the same time, the Atlanta MSA’s white children under 15 were four times as likely as the region’s Black children under 15 to live in well-above-average opportunity neighborhoods (24% vs. 6%) (See Table 12).
Conclusion
Low opportunity neighborhoods can have a detrimental effect on children’s educational success, adults’ and children’s physical and mental health, and adults’ lifetime earning potential and economic self-sufficiency. Nationally, Census tracts where rental housing and where Black households and children were concentrated in 1990 had a worse track record of boosting residents up the economic ladder; lower-income children growing up in these areas had below-average earnings as adults relative to lower-income children growing up in higher opportunity sections of the same metropolitan areas. This was particularly the case in the nation’s more racially segregated MSAs and where restrictive zoning ordinances had more aggressively limited the land available for multifamily housing. While access to opportunity has improved for renters, lower-income households, and Black households since 1990, current conditions suggest that substantial barriers to higher opportunity neighborhoods, and neighborhood disparities between Black and white residents, remain.
The Atlanta MSA offers a fascinating lens into these dynamics and disparities. In 1990, rental housing was far more concentrated in lower-opportunity areas, and the region’s higher-than-average opportunity neighborhood tended to have fewer rental options. The region was also a highly segregated MSA, where Black and white households experienced very different neighborhood conditions and where a majority of renters and the vast majority of Black households lived in low-opportunity neighborhoods. As this analysis found, that year, most (56%) Black renters and 61% of low-income Black households in the region lived in well-below-average opportunity neighborhoods. This compared to less than ten percent of low-income white household (9%) and white renters (8%). At the same time, over half (56%) of all Black children (under age 15) in the Atlanta MSA lived in well-below-average opportunity neighborhoods and fully 82% lived in neighborhoods with less-than-average opportunity. Among white children, only 20% lived in less-than-average opportunity neighborhoods that year, and just 4% lived in the lowest-opportunity areas.
But something powerful has occurred in the years since, thanks to an overall population and building boom in the Atlanta MSA, a growing Black middle class, and high (among the nation’s highest) numbers of Black homeowners and suburbanites. Between 1990 and 2019, more rental units became available in the region’s higher-opportunity neighborhoods. Even more importantly, far more than in comparable MSAs, the Atlanta MSA’s Black households deconcentrated out of low-opportunity areas. This study found that by 2019, the percentage of Black owners in well-below-average opportunity neighborhoods in the Atlanta MSA had fallen by more than half, from 54% to 20%, as the percentage of Black owners living in well-below-average opportunity neighborhoods remained close to or over half in the New York (40%), Philadelphia (48%) and Chicago (54%) MSAs. Similarly, between 1990 and 2019, the portion of the Atlanta MSA’s Black renters in well-below-average opportunity neighborhoods declined from 56% to 30%, as this comparable percentage remained close to or over half in the Washington, DC (41%), Philadelphia (51%), New York (58%) and Chicago (58%) MSAs.
The challenge going forward, for the Atlanta MSA and MSAs nationwide, is to create still more access into high-opportunity neighborhoods for more households. Additionally, a separate challenge is to also ensure that high opportunity neighborhoods remain successful at boosting residents up the economic ladder as they diversify (along race and class lines) and as they house a growing mix of housing types and tenures. This will require contemporary measures for neighborhood opportunity to bring Opportunity Insights’ estimates current. Indicators like the Department of Housing and Urban Development’s Opportunity Indices, and other measures quantifying neighborhood safety, pollution levels, population health, school quality, and social networks, could be a start.46 Unfortunately, these measures suggest the presence of potentially destabilizing forces in diversifying higher-opportunity neighborhoods. Preliminary research, for example, found worse resident health outcomes (larger portions of adults reporting poor mental health or fair or poor physical health, and shorter overall life expectancy), more environmental hazards (according to HUD’s Environmental Hazard Index), and lower performing schools (according to HUD’s School Proficiency Index), in the Atlanta MSA’s higher-than-average opportunity area with rising shares of Black residents between 1990 and 2019 than comparable areas that remained largely white. Far mor research is needed to understand what might deny non-white households access to opportunity even as they move into what were once higher-opportunity areas, and how to best counter those forces.
Whether looking at expanded access to opportunity or the fragility of neighborhood opportunity as neighborhoods grow and change and diversify, the Atlanta MSA offers a valuable case study. On the one hand, the region is on the front lines of expanded access: renters, low-income households, and Black households are less concentrated in low-opportunity neighborhoods in the Atlanta MSA than in comparable MSAs. On the other hand, stubbornly high levels of residential segregation maintain and reinforce disparities between those places where white and Black households live; high levels of residential segregation also make the region’s diverse and diversifying areas at risk of disinvestment and devaluation, both things that threaten ongoing neighborhood “opportunity.” It will likely take a mix of fair housing efforts, community and economic development, and targeted investments in those amenities most vital to residents’ well-being and upward mobility, to harness the region’s strengths and mitigate these threats.
Karen Beck Pooley is a Professor of Practice of Political Science and co-directs the Small Cities Lab at Lehigh University. She also serves as the Director of Research and Analytics at czb LLC, an urban planning and neighborhood revitalization consulting firm. She previously ran Allentown’s Redevelopment Authority and was a Deputy Director within New York City’s Department of Housing Preservation and Development. She has a Bachelor of Arts in Political Science from Wellesley College, a Master of Urban Planning & Policy from New School University’s Milano Graduate School, and a Ph.D. in City Planning from the University of Pennsylvania
Citation: Pooley, Karen. “Who has Access to Atlanta’s Geography of Opportunity.” Atlanta Studies. April 30, 2024. [INSERT DOI HERE]
References
Aliprantis, Dionissi, and Hal Martin. “Neighborhood Sorting Obscures Neighborhood Effects in the Opportunity Atlas.” SSRN Working Paper 3740819 (2020).
Aliprantis, Dionissi, Hal Martin, and David Phillips. “Landlords and Access to Opportunity.” Journal of Urban Economics 129 (May 1, 2022): 103420. https://doi.org/10.1016/j.jue.2021.103420.
Briggs, Xavier de Souza, and Margery Austin Turner. “Assisted Housing Mobility and the Success of Low-Income Minority Families: Lessons for Policy, Practice, and Future Research.” Northwestern Journal of Law & Social Policy 1 (2006): 25-61.
Cashin, Sheryll. White Space, Black Hood: Opportunity Hoarding and Segregation in the Age of Inequality. Boston, MA: Beacon Press, 2021.
Chetty, Raj, John N. Friedman, Nathaniel Hendren, Maggie R. Jones, and Sonya R. Porter. “The Opportunity Atlas: Mapping the Childhood Roots of Social Mobility.” NBER Working Paper Series 25147 (October 2018). http://www.nber.org/papers/w25147
Chetty, Raj, and Nathaniel Hendren. Household Income and Incarceration for Children from Low-Income Households by Census Tract, Race, and Gender. [Opportunity Atlas Data Tables]. September 2018. Distributed by United States Census Bureau. https://opportunityinsights.org/wp-content/uploads/2018/10/tract_outcomes_simple.csv.
———. The Impacts of Neighborhoods on Intergenerational Mobility: Childhood Exposure Effects and County-Level Estimates. Cambridge, MA: Harvard University and NBER, 2015.
Chetty, Raj, Nathaniel Hendren, Maggie R. Jones, and Sonya R. Porter. “Race and Economic Opportunity in the United States: An Intergenerational Perspective.” The Quarterly Journal of Economics 135, no. 2 (2020): 711–83.
Chetty, Raj, Nathaniel Hendren, Patrick Kline, and Emmanuel Saez. “Where Is the Land of Opportunity? The Geography of Intergenerational Mobility in the United States.” The Quarterly Journal of Economics 129, no. 4 (November 1, 2014): 1553–1623. https://doi.org/10.1093/qje/qju022.
Chyn, Eric, and Lawrence F. Katz. “Neighborhoods Matter: Assessing the Evidence for Place Effects.” Journal of Economic Perspectives 35, no. 4 (2021): 197–222.
Clayton, Obie, Cynthia Hewitt, and Gregory Hall. “Atlanta and’The Dream’: Race, Ethnicity, and Recent Demographic and Socioeconomic Trends.” In Past Trends and Future Prospects of the American City: The Dynamics of Atlanta, edited by David L. Sjoquist, 219–48. Lanham, MD: Lexington Books, 2009.
Ellen, Ingrid Gould, and Margery Austin Turner. “Does Neighborhood Matter? Assessing Recent Evidence.” Housing Policy Debate 8, no. 4 (1997): 833–66.
Galster, George C., and Sean P. Killen. “The Geography of Metropolitan Opportunity: A Reconnaissance and Conceptual Framework.” Housing Policy Debate 6, no. 1 (January 1, 1995): 7–43. https://doi.org/10.1080/10511482.1995.9521180.
Galster, George, and Patrick Sharkey. “Spatial Foundations of Inequality: A Conceptual Model and Empirical Overview.” RSF: The Russell Sage Foundation Journal of the Social Sciences 3, no. 2 (2017): 1–33.
Galster, George, and Anne Zobel. “Will Dispersed Housing Programmes Reduce Social Problems in the US?” Housing Studies 13, no. 5 (1998): 605–22.
Gourevitch, Ruth, Solomon Greene, and Rolf Pendall. Place and Opportunity: Using Federal Fair Housing Data to Examine Opportunity across US Regions and Populations. Washington, DC: Urban Institute, June 26, 2018. https://policycommons.net/artifacts/631055/place-and-opportunity/.
Hanson, Andrew, and Zackary Hawley. “Do Landlords Discriminate in the Rental Housing Market? Evidence from an Internet Field Experiment in US Cities.” Journal of Urban Economics 70, no. 2 (2011): 99–114. https://doi.org/10.1016/j.jue.2011.02.003.
Hess, Chris, Gregg Colburn, Kyle Crowder, and Ryan Allen. “Racial Disparity in Exposure to Housing Cost Burden in the United States: 1980–2017.” Housing Studies 37, no. 10 (2022): 1821–41.
“How Do Neighborhoods Affect Economic Opportunity? (Local Area Rankings),” n.d. http://www.equality-of-opportunity.org/neighborhoods/.
Joint Center for Housing Studies of Harvard University. America’s Rental Housing 2020. Cambridge, MA: Joint Center for Housing Studies of Harvard University, 2020. https://www.jchs.harvard.edu/americas-rental-housing-2020.
Knaap, Elijah. “The Cartography of Opportunity: Spatial Data Science for Equitable Urban Policy.” Housing Policy Debate 27, no. 6 (2017): 913–40.
Kulkarni, Nirupama, and Ulrike Malmendier. “Homeownership Segregation.” Journal of Monetary Economics 129 (2021): 123-49.
Lloyd, Richard. “Urbanization and the Southern United States.” Annual Review of Sociology 38, no. 1 (2012): 483–506. https://doi.org/10.1146/annurev-soc-071811-145540.
Logan, John. Diversity and Disparities: Residential Segregation. 2021. Distributed by Russel Sage Foundation and American Communities Project. https://s4.ad.brown.edu/Projects/Diversity/data/data.htm.
———. “The Persistence of Segregation in the 21st Century Metropolis.” City & Community 12, no. 2 (2013): 160–68. https://doi.org/10.1111/cico.12021.
Manville, Michael, Paavo Monkkonen, and Michael Lens. “It’s Time to End Single-Family Zoning.” Journal of the American Planning Association 86, no. 1 (2020): 106–12.
Massey, Douglas, and Nancy A. Denton. American Apartheid: Segregation and the Making of the Underclass. Cambridge, MA: Harvard University Press, 1993.
Mast, Brent D., and Alexander Din. “Measuring Neighborhood Opportunity with Opportunity Atlas and Child Opportunity Index 2.0 Data.” Cityscape 23, no. 1 (2021): 237–56.
McClure, Kirk. “The Prospects for Guiding Housing Choice Voucher Households to High-Opportunity Neighborhoods.” Cityscape 12, no. 3 (2010): 101–22.
McClure, Kirk, and Alex Schwartz. “Small Area Fair Market Rents, Race, and Neighborhood Opportunity.” Cityscape 21, no. 3 (2019): 49–70.
Mijs, Jonathan J. B., and Elizabeth L. Roe. “Is America Coming Apart? Socioeconomic Segregation in Neighborhoods, Schools, Workplaces, and Social Networks, 1970–2020.” Sociology Compass 15, no. 6 (2021): e12884. https://doi.org/10.1111/soc4.12884.
Ondrich, Jan, Alex Stricker, and John Yinger. “Do Landlords Discriminate? The Incidence and Causes of Racial Discrimination in Rental Housing Markets.” Journal of Housing Economics 8, no. 3 (1999): 185–204. https://doi.org/10.1006/jhec.1999.0249.
Rosenbaum, James E. “Changing the Geography of Opportunity by Expanding Residential Choice: Lessons from the Gautreaux Program.” Housing Policy Debate 6, no. 1 (January 1, 1995): 231–69. https://doi.org/10.1080/10511482.1995.9521186.
Rothwell, Jonathan T., and Douglas S. Massey. “Density Zoning and Class Segregation in U.S. Metropolitan Areas.” Social Science Quarterly 91, no. 5 (December 2010): 1123–43.
Sampson, Robert J., Jeffrey D. Morenoff, and Thomas Gannon-Rowley. “Assessing ‘Neighborhood Effects’: Social Processes and New Directions in Research.” Annual Review of Sociology 28 (2002): 443–78.
Silverman, Robert Mark, Li Yin, and Kelly L. Patterson. “Siting Affordable Housing in Opportunity Neighborhoods: An Assessment of HUD’s Affirmatively Furthering Fair Housing Mapping Tool.” Journal of Community Practice 25, no. 2 (April 2017): 143–58.
Tilly, Charles. Durable Inequality. Berkeley, CA: University of California Press, 1998.
Turner, Margery Austin, and Maris Mikelsons. “Patterns of Racial Steering in Four Metropolitan Areas.” Journal of Housing Economics 2, no. 3 (1992): 199–234. https://doi.org/10.1016/1051-1377(92)90001-7.
Wang, Ruoniu, Rebecca J. Walter, Abdulnaser A. Arafat, Xuesong Ding, and Ammar A. Naji. “Examining Neighborhood Opportunity and Locational Outcomes for Housing Choice Voucher Recipients: A Comparative Study between Duval County, Florida, and Bexar County, Texas.” City & Community 16, no. 4 (2017): 421–46.
Notes
- Ingrid Gould Ellen and Margery Austin Turner, “Does Neighborhood Matter? Assessing Recent Evidence,” Housing Policy Debate 8, no. 4 (1997): 834. ↩︎
- Eric Chyn and Lawrence F. Katz, “Neighborhoods Matter: Assessing the Evidence for Place Effects,” Journal of Economic Perspectives 35, no. 4 (2021): 199. ↩︎
- The Atlanta-Sandy Springs-Roswell, GA Metropolitan Statistical Area (or “Atlanta MSA”) includes the following 29 counties: Barrow, Bartow, Butts, Carroll, Cherokee, Clayton, Cobb, Coweta, Dawson, DeKalb, Douglas, Fayette, Forsyth, Fulton, Gwinnett, Haralson, Heard, Henry, Jasper, Lamar, Meriwether, Morgan, Newton, Paulding, Pickens, Pike, Rockdale, Spalding, and Walton. ↩︎
- Obie Clayton, Cynthia Hewitt, and Gregory Hall, “Atlanta and ‘The Dream’: Race, Ethnicity, and Recent Demographic and Socioeconomic Trends,” in Past Trends and Future Prospects of the American City: The Dynamics of Atlanta, ed. David L. Sjoquist (Lanham, MD: Lexington Books, 2009), 219; Richard Lloyd, “Urbanization and the Southern United States,” Annual Review of Sociology 38, no. 1 (2012): 498, https://doi.org/10.1146/annurev-soc-071811-145540. ↩︎
- These figures are based on the author’s analysis of the 2019 American Community Survey 1-Year Estimates, Tables B02001 and B25003B. ↩︎
- “How Do Neighborhoods Affect Economic Opportunity? (Local Area Rankings),” n.d., http://www.equality-of-opportunity.org/neighborhoods/. ↩︎
- Logan, “Diversity and Disparities: Residential Segregation,” 2021. ↩︎
- John Logan, “The Diversity and Disparities Project,” n.d., https://s4.ad.brown.edu/projects/diversity/Data/data.htm. ↩︎
- Raj Chetty and Nathaniel Hendren, The Impacts of Neighborhoods on Intergenerational Mobility: Childhood Exposure Effects and County-Level Estimates, (Cambridge, MA: Harvard University and NBER, 2015), 74. ↩︎
- Michael Manville, Paavo Monkkonen, and Michael Lens, “It’s Time to End Single-Family Zoning,” Journal of the American Planning Association 86, no. 1 (2020): 106–12. ↩︎
- Joint Center for Housing Studies of Harvard University, America’s Rental Housing 2020 (Cambridge, MA: Joint Center for Housing Studies of Harvard University, 2020), https://www.jchs.harvard.edu/americas-rental-housing-2020. ↩︎
- Nirupama Kulkarni and Ulrike Malmendier, “Homeownership Segregation,” 2021. ↩︎
- These figures are based on the author’s analysis of data from the 2021 American Community Survey 1-Year Estimates, Tables B25003 and B25032. ↩︎
- Manville, Monkkonen, and Lens, “It’s Time to End Single-Family Zoning.” ↩︎
- Joint Center for Housing Studies of Harvard University, America’s Rental Housing 2020 (Cambridge, MA: Joint Center for Housing Studies of Harvard University, 2020), 16. ↩︎
- These figures are based on the author’s analysis of data from the 2019 American Community Survey 5-Year Estimates, Table B25003. ↩︎
- Sheryll Cashin, White Space, Black Hood: Opportunity Hoarding and Segregation in the Age of Inequality (Boston, MA: Beacon Press, 2021), 111; Michael Manville, Paavo Monkkonen, and Michael Lens, “It’s Time to End Single-Family Zoning,” Journal of the American Planning Association 86, no. 1 (2020): 106. ↩︎
- George Galster and Patrick Sharkey, “Spatial Foundations of Inequality: A Conceptual Model and Empirical Overview,” RSF: The Russell Sage Foundation Journal of the Social Sciences 3, no. 2 (2017): 11; Charles Tilly, Durable Inequality (Berkeley, CA: University of California Press, 1998), 81. ↩︎
- Kulkarni and Malmendier, “Homeownership Segregation”; Ruoniu Wang et al., “Examining Neighborhood Opportunity and Locational Outcomes for Housing Choice Voucher Recipients: A Comparative Study between Duval County, Florida, and Bexar County, Texas,” City & Community 16, no. 4 (2017): 421–46. ↩︎
- Jonathan J. B. Mijs and Elizabeth L. Roe, “Is America Coming Apart? Socioeconomic Segregation in Neighborhoods, Schools, Workplaces, and Social Networks, 1970–2020,” Sociology Compass 15, no. 6 (2021): e12884, 5, https://doi.org/10.1111/soc4.12884. ↩︎
- Jonathan T. Rothwell and Douglas S. Massey, “Density Zoning and Class Segregation in U.S. Metropolitan Areas,” Social Science Quarterly 91, no. 5 (December 2010): 1123–43. ↩︎
- Logan, “Diversity and Disparities: Residential Segregation”; Douglas Massey and Nancy A. Denton, American Apartheid: Segregation and the Making of the Underclass (Cambridge, MA: Harvard University Press, 1993). ↩︎
- Logan, “Diversity and Disparities: Residential Segregation”; John Logan, “The Persistence of Segregation in the 21st Century Metropolis,” City & Community 12, no. 2 (2013): 160–68, https://doi.org/10.1111/cico.12021. ↩︎
- Logan, “The Diversity and Disparities Project.” ↩︎
- Logan, “Diversity and Disparities: Residential Segregation,” 12. ↩︎
- Andrew Hanson and Zackary Hawley, “Do Landlords Discriminate in the Rental Housing Market? Evidence from an Internet Field Experiment in US Cities,” Journal of Urban Economics 70, no. 2 (2011): 99, https://doi.org/10.1016/j.jue.2011.02.003. ↩︎
- Chris Hess et al., “Racial Disparity in Exposure to Housing Cost Burden in the United States: 1980–2017,” Housing Studies 37, no. 10 (2022): 1821. ↩︎
- Hanson and Hawley, “Do Landlords Discriminate in the Rental Housing Market?,” 99. ↩︎
- Jan Ondrich, Alex Stricker, and John Yinger, “Do Landlords Discriminate? The Incidence and Causes of Racial Discrimination in Rental Housing Markets,” Journal of Housing Economics 8, no. 3 (1999): 201. ↩︎
- Margery Austin Turner and Maris Mikelsons, “Patterns of Racial Steering in Four Metropolitan Areas,” Journal of Housing Economics 2, no. 3 (1992): 220. ↩︎
- Raj Chetty et al., “Race and Economic Opportunity in the United States: An Intergenerational Perspective,” The Quarterly Journal of Economics 135, no. 2 (2020): 776-77. ↩︎
- Dionissi Aliprantis, Hal Martin, and David Phillips, “Landlords and Access to Opportunity,” Journal of Urban Economics 129 (May 1, 2022): 103420. ↩︎
- Galster and Sharkey, “Spatial Foundations of Inequality”; Elijah Knaap, “The Cartography of Opportunity: Spatial Data Science for Equitable Urban Policy,” Housing Policy Debate 27, no. 6 (2017): 913. ↩︎
- George C. Galster and Sean P. Killen, “The Geography of Metropolitan Opportunity: A Reconnaissance and Conceptual Framework,” Housing Policy Debate 6, no. 1 (January 1, 1995): 7–43, https://doi.org/10.1080/10511482.1995.9521180; Galster and Sharkey, “Spatial Foundations of Inequality”; Knaap, “The Cartography of Opportunity”; James E. Rosenbaum, “Changing the Geography of Opportunity by Expanding Residential Choice: Lessons from the Gautreaux Program,” Housing Policy Debate 6, no. 1 (January 1, 1995): 231–69, https://doi.org/10.1080/10511482.1995.9521186. ↩︎
- Chyn and Katz, “Neighborhoods Matter.” ↩︎
- Knaap, “The Cartography of Opportunity.” ↩︎
- Chyn and Katz, “Neighborhoods Matter”; Galster and Sharkey, “Spatial Foundations of Inequality”; Knaap, “The Cartography of Opportunity.” ↩︎
- Knaap, “The Cartography of Opportunity,” 923. ↩︎
- Raj Chetty et al., The Opportunity Atlas, 2018; Chyn and Katz, “Neighborhoods Matter”; Brent D. Mast and Alexander Din, “Measuring Neighborhood Opportunity with Opportunity Atlas and Child Opportunity Index 2.0 Data,” Cityscape 23, no. 1 (2021): 237–56. ↩︎
- Chetty et al., The Opportunity Atlas, 28. ↩︎
- Dionissi Aliprantis and Hal Martin, “Neighborhood Sorting Obscures Neighborhood Effects in the Opportunity Atlas,” SSRN Working Paper 3740819, 2020, 11; Chyn and Katz, “Neighborhoods Matter,” 210. ↩︎
- Chetty et al., The Opportunity Atlas, 4. ↩︎
- Chetty et al., The Opportunity Atlas, 4
↩︎ - This income level ($25,000) was near the upper limit of the second income quintile in 1990, and was equivalent to roughly $49,000 and the upper limit of the second income quintile in 2019. ↩︎
- Officially the Chicago-Naperville-Elgin, IL-IN-WI MSA, the New York-Newark-Jersey City, NY-NJ-PA MSA, the Philadelphia-Camden-Wilmington, PA-NJ-DE-MD MSA, and the Washington-Arlington-Alexandria, DC-VA-MD-WV MSA. ↩︎
- Xavier de Souza Briggs and Margery Austin Turner, “Assisted Housing Mobility and the Success of Low-Income Minority Families: Lessons for Policy, Practice, and Future Research,” Northwestern Journal of Law & Social Policy 1 (2006): 25; Raj Chetty et al., “Where Is the Land of Opportunity? The Geography of Intergenerational Mobility in the United States,” The Quarterly Journal of Economics 129, no. 4 (November 1, 2014): 1553–1623, https://doi.org/10.1093/qje/qju022; Ellen and Turner, “Does Neighborhood Matter?”; George Galster and Anne Zobel, “Will Dispersed Housing Programmes Reduce Social Problems in the US?,” Housing Studies 13, no. 5 (1998): 605–22; Ruth Gourevitch, Solomon Greene, and Rolf Pendall, Place and Opportunity: Using Federal Fair Housing Data to Examine Opportunity across US Regions and Populations (Washington, DC: Urban Institute, June 26, 2018), https://policycommons.net/artifacts/631055/place-and-opportunity/; Kirk McClure, “The Prospects for Guiding Housing Choice Voucher Households to High-Opportunity Neighborhoods,” Cityscape 12, no. 3 (2010): 101–22; Kirk McClure and Alex Schwartz, “Small Area Fair Market Rents, Race, and Neighborhood Opportunity,” Cityscape 21, no. 3 (2019): 49–70; Robert J. Sampson, Jeffrey D. Morenoff, and Thomas Gannon-Rowley, “Assessing ‘Neighborhood Effects’: Social Processes and New Directions in Research,” Annual Review of Sociology 28 (2002): 443–78; Robert Mark Silverman, Li Yin, and Kelly L. Patterson, “Siting Affordable Housing in Opportunity Neighborhoods: An Assessment of HUD’s Affirmatively Furthering Fair Housing Mapping Tool.,” Journal of Community Practice 25, no. 2 (April 2017): 143–58. ↩︎