Citation: Hollingsworth, Keith. “Perseverance: Black Business Response to the Atlanta Race Massacre.” Atlanta Studies. May 27, 2025. https://doi.org/10.18737/atls20250527
Introduction
On the night of Saturday, September 22, 1906, Mattie Adams and her family closed the door of her lunch room at 197 Peters Street, huddling in the darkness and hoping the mob of white men terrorizing Atlanta would pass them by. But it was not to be. With shouts of “Let’s kill every damn n****r we see“, the mob stopped in front of their establishment. George W. Blackstock broke out the windowpane in the door, loosened the bolt, and rushed in. He then clubbed Mrs. Adams on the head with a wagon spoke sending her to the floor. When she tried to rise another man hit her with a salt pitcher. A third man began target practice, shooting at her grandson as he ran out the back door. The mob destroyed the lunch room, breaking up show cases and furniture. Then the riot moved on down the street to vandalize a hardware store and then eventually back to downtown Atlanta. Thankfully, Mattie Adams, her daughter Alice Kelly, and her grandson all survived the night.1
The attack on Adams was just one of many traumatic events that occurred during the 1906 Atlanta Race Massacre, with many others not surviving as she did. That Saturday, rampaging mobs of white men traversed the downtown area attacking any Black person on sight, overwhelming streetcars to assault Black passengers, and destroying Black businesses. Over the next two and a half days, authorities attempted to bring peace by harassing and over-policing Black neighborhoods to prevent a feared retaliation that never manifested.2
Black neighborhoods did not retaliate; however, they did demonstrate a willingness to fight to protect their homes and neighborhoods. For those few days, Atlanta business came to a standstill as the city was paralyzed by fear. City officials, horrified by the damage to the city’s reputation, began on Tuesday to make efforts to bring an end to the unrest and restart downtown life.3
The effects of the massacre were long-lasting. Though the events of those days were soon whitewashed and minimized in official histories, only coming back to the forefront of public consciousness in the days leading up to the centennial remembrance, memories lingered for generations, particularly in the Black community. A central piece of the legacy of the 1906 massacre was the creation of Atlanta’s Black business neighborhoods, such as Sweet Auburn Avenue and West Hunter Street (now Martin Luther King, Jr. Drive)/Atlanta University Center (AUC).4 More than one writer has suggested that the massacre led to increased segregation, not purely because of zoning laws, but as a means of self-protection. Black businesses, it is suggested, moved toward Black-dominated neighborhoods voluntarily to better defend themselves, reflecting the efforts of Black neighborhoods such as Darktown and Brownsville that did so during the massacre.5
However, evidence unearthed by the present research does not bear this assertion out in toto. A careful analysis of the location of Black businesses in Atlanta in the years of 1904, 1906, 1908, and 1910 does not show a large movement of Black businesses in the years immediately after the massacre. While the percentage of Black businesses in the Central Business District, the location of the massacre’s true horrors, diminished in the years afterward, the actual number of Black businesses in that area grew. The dispersion of Black businesses immediately after these shocking events appears to have been driven more by the overall growth and spatial expansion of the city. And while more than one thousand Black residents were said to have left the city in the days after the massacre never to return, the growth of Black businesses merely plateaued and then expanded substantially by 1910.6
Building a Database
The purpose of this research was to measure, if possible, the movement of Black businesses following the 1906 massacre. Based on data extracted from the Atlanta city directories, a dataset was created that included each Black business listed, its business type, and its address. These addresses were then geocoded, a process of identifying the geographic coordinates of features in a dataset. The data were gathered from the directories of 1904, 1906, 1908, and 1910.7 The directories stated that the data were considered accurate for January 1 of the given year. So, the 1908 city directory shows the state of affairs approximately fourteen months after the massacre took place. Given that the massacre occurred within the 1904–1910 period, one can trace the location of Black businesses both before and after the tragedy.
The Atlanta City Directory was published annually starting no later than 1880. Foote & Davies Co. and Joseph W. Hill (Manager) were the publishers. The directories in the early 1900s consisted of three sections:
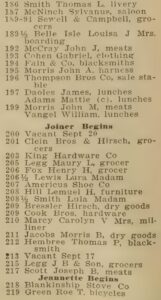
Figure 1. Street Directory from Atlanta City Directory (1910)8.
1. Street Directory (Figure 1): This section tracked each street, giving the street numbers and the occupants from beginning to end, and designated where the cross streets occurred. This section was very useful when geocoding, as it helped to pinpoint the block on which any street address was located. Mattie Adams can be seen at 197 Peters Street.
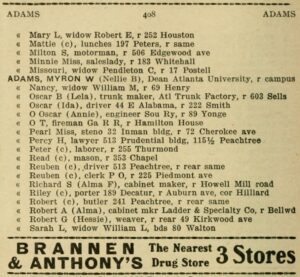
Figure 2. Residential Directory from Atlanta City Directory (1906)9
2. Residential Directory (Figure 2): This section listed the households and businesses in Atlanta. (This is similar to the White Pages in telephone books of the latter part of the twentieth century.) For a residence, the male head of household was listed with his wife’s name in parentheses. Immediately afterward the directory listed the occupation, occasionally the location of the occupation, and then the residential address preceded by the letter r. The directory did not list the wives of Black men until 1910. If there was no male head of household, then the woman’s name would be listed with a ‘Miss’ or ‘Mrs.’ It was occasionally noted that the woman in question was a widow. Black women, though, were denied this courtesy, and no Black woman was given the title of ‘Miss’ or ‘Mrs.’ throughout the period in question. This shows us that Mattie Adams also lived at 197 Peters Street where she operated her lunchroom.
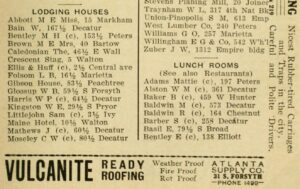
Figure 3. Business Directory from Atlanta City Directory (1906)10
3. Business Directory (Figure 3): This section listed the businesses in Atlanta that chose to pay for their inclusion, similar to the Yellow Pages of later telephone books. While the publishers sought to include all residences, a business had to pay to be included in the business directory. The businesses were sorted according to industry or product, and it was very common for a business to appear under multiple categories. Categories might include ‘Barbers,’ ‘Lunch Rooms,’ or ‘Shoe Makers.’ This limited the businesses included in this dataset: It only includes the most ‘formal’ businesses, given they were most likely to pay for this advertisement and were most likely to have a permanent address to list. A prominent example of what is not included is laundresses. Many Black women operated entrepreneurially as laundresses, but none are listed in this section of the directory. These women most likely operated out of their homes in an informal manner, although they were organized enough to have managed a successful strike in Atlanta during the 1880s.11 In addition, because Black women were not given the honorific ‘Miss’ or ‘Mrs.’ in these directories, we cannot accurately separate out men and women Black entrepreneurs. Again, we see Mattie Adams running a lunch room at 197 Peters Street.
It was easy to separate Black and white residences or businesses, as all names of Black people in the directory, in any section, has a (c) listed behind the name. The only exception was when a Black business bought an advertisement. The advertisements in general have no designation that shows the race of the owner. It also appears the (c) designation only applied to those racialized as Black. Atlanta had a listing of Chinese laundries where every name is Asian in origin and that designation does not appear. This is also true of Hispanic owners (judged by name and business).
Every Black business listed in the Business Directory portion of the city directories was entered into a spreadsheet. The dataset includes the first name (usually initials in this section), last name, street number, street direction, street name, and business type. This process was repeated for all four years. Once data entry was completed, the addresses were geocoded using Google Maps to find the latitude and longitude for each location. The geocoding process required triangulation of the Street Directory portion of the directory showing where an address was located between cross streets, the Sanborn Maps of Atlanta, using both the 1899 and the 1911 maps, and the current Google Maps, which gave the latitude/longitude once the location was established. The author has been a resident of Atlanta for forty years, so personal knowledge of the area also helped in establishing probable locations.12 Addresses like 138 W Mitchell Street and 138½ W Mitchell Street were treated as the same address, as to do otherwise would imply a precision that simply does not exist. Atlanta’s street addresses changed in 1927, so one cannot simply apply the number given at that time to what exists today. Also, several streets and areas existing in the early 1900s have been wiped out by interstates and other major projects, such as the World Congress Center and Mercedes-Benz Stadium. Of course, these urban renewal projects often hit Black areas, and that can be seen on the maps, which show several business locations that would currently be located in the middle of an interstate. In the end, geographic coordinates were established for more than 97 percent of the listings.
After the mapping was completed, the businesses were reconciled across the years. For example, Mattie Adams operated the lunch room at 197 Peters Street in all four directories. Her record needed to be linked to show this was one person and not four different people. Reconciliation was occasionally challenging. Charles Bailey might be listed in 1904 and then Charles Baily in 1906. Those linkages could only be found through personal inspection of the sources. It was common for a business owner to operate different business types at the same address. For example, the same owner was listed operating a lunch room in 1906 and then a grocery in 1908 but at the same address. It was clear that definitive categories did not necessarily apply in this environment. It was entirely possible that owners might sell groceries as well as plates of prepared food. The business directory, being in essence a paid advertisement, would report what the owner wanted to say. In one instance, a grocery, lunch room, and barbershop operated at the same address in the same directory.
The residential directory helped in the reconciliation process, as it often listed the first name and the residential address, so it could be consulted to verify that two listings from separate years were for the same person. The final dataset comprised 1541 separate business entries over the four years. Only 116 of the listings (7.5 percent) were present in all four directories. The majority only showed up in one of the four directories.
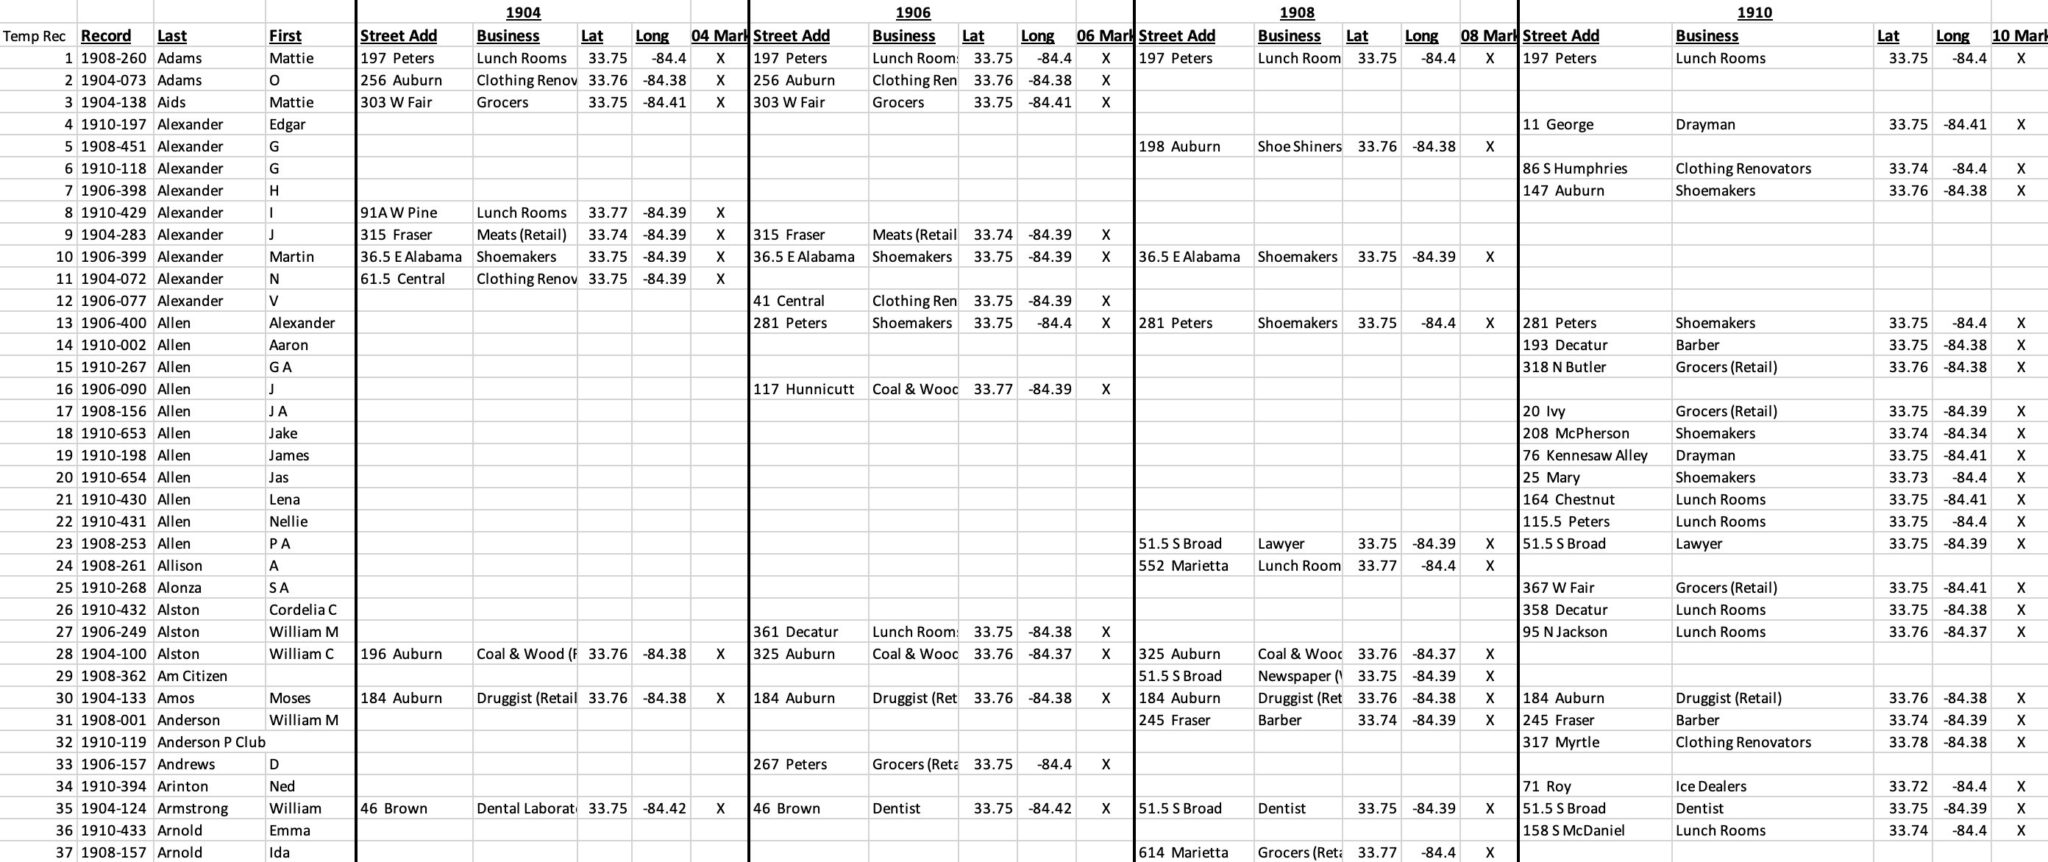
Figure 4. Reconciled Data Set
This dataset is available for exploration (with citation) at the Atlanta University Center Woodruff Library’s Repository of AUC Digital Collections, Archives, and Research (RADAR).13 An example of this reconciled dataset is shown in Figure 4.
Data Analysis
An analysis of Black businesses using this dataset yields four significant findings. First, a quick examination of the data shows that most Black businesses were in service industries. Table 1 illustrates that approximately 60 percent of all Black businesses in Atlanta were of five different types: lunch rooms, barbers, shoemakers, grocers, and clothing renovators (tailors). This offers corroborating evidence for W. E. B. Du Bois’s analysis at the Negro in Business conference held in Atlanta in 1899 just a few years before the period under discussion. Du Bois noted that Black businesses developed along the lines of skills learned on the plantations. House servants became barbers, tailors, and cooks; plantation mechanics became shoemakers; and the trading culture of the plantation led to grocers.14
Table 1. Top Five Business Types Per Year
1904
1906
1908
1910
Occupations
#
%
#
%
#
%
#
%
Lunch Rooms
79
19.0%
110
21.3%
88
17.2%
133
16.2%
Shoemakers
71
17.1%
71
13.7%
83
16.2%
123
15.0%
Barber
39
9.4%
66
12.8%
65
12.7%
76
9.3%
Grocers
35
8.4%
52
10.1%
57
11.1%
73
8.9%
Clothing Reno/Tailor
30
7.2%
33
6.4%
53
10.3%
67
8.2%
Total
254
61.2%
332
64.2%
346
67.4%
472
57.5%
This data demonstrates the limited number of businesses that were open to Black entrepreneurs. The 1904 business directory had 657 different business classifications.15 However, only fifty of those classifications (8 percent) could boast at least one Black proprietor. No Black manufacturers, wholesalers, or mercantile agents are listed. The number of Black professionals (lawyers, doctors, etc.) is miniscule.16
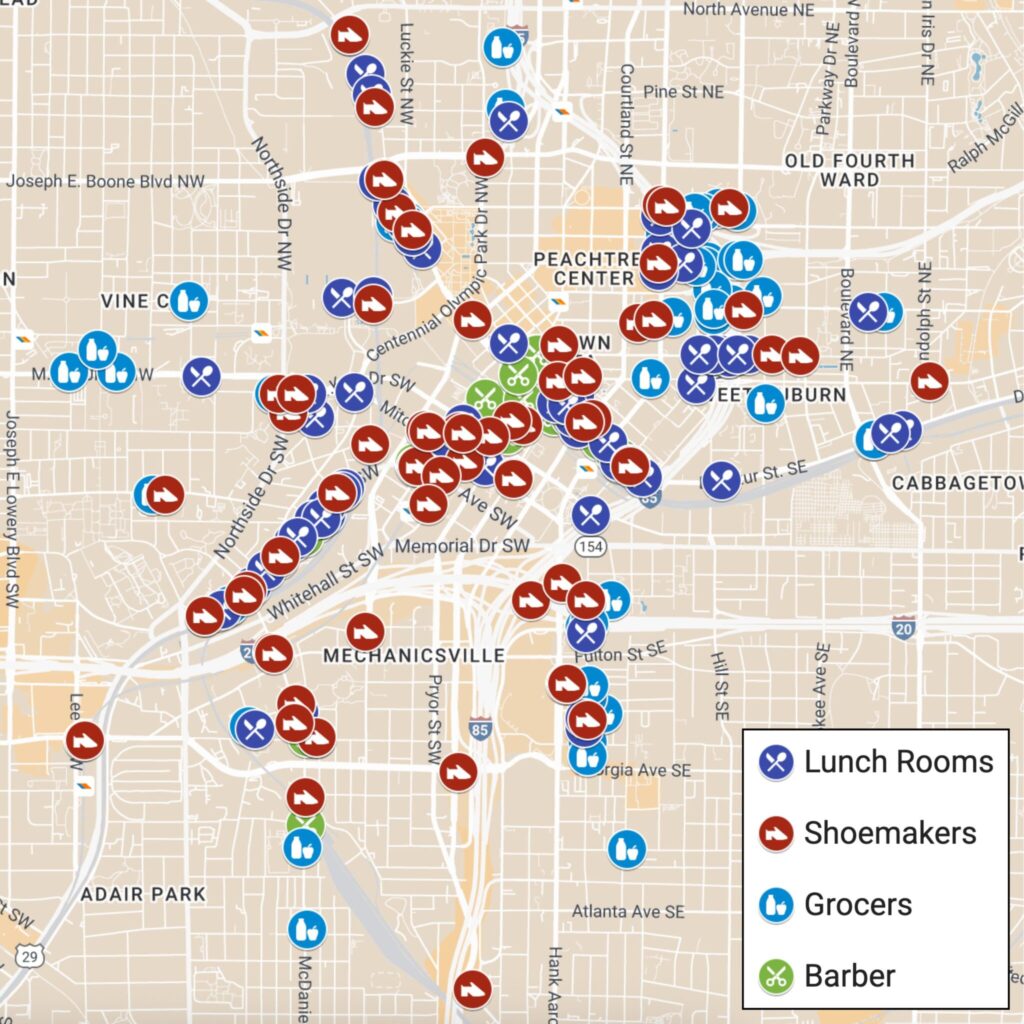
Second, mapping the data shows the wide dispersion of Black businesses across the city. The business locations were mapped using both mymaps.google.com and ArcGIS. Figure 5 shows the location, for example, of the top four business types of 1904. Black businesses were integrated throughout the city and served multiple clienteles. The key element, however, is the location of Black grocers. The other types of businesses (Barbers, Clothing Renovators, Shoemakers, etc.) could have been geared toward a white clientele. Most of those businesses located in the Central Business District of Atlanta, for example, would have been patronized primarily, if not exclusively, by whites. However, one would not find a Black grocer that had a predominantly white clientele.17 No Black grocers are in this Central Business District. Therefore, where we see Black grocers, we know this to be an area with a cluster of Black residences.
Figure 5. Locations of Four Most Frequent Business Types in 1904 (Barbers, Lunch Rooms, Grocers, and Shoemakers)
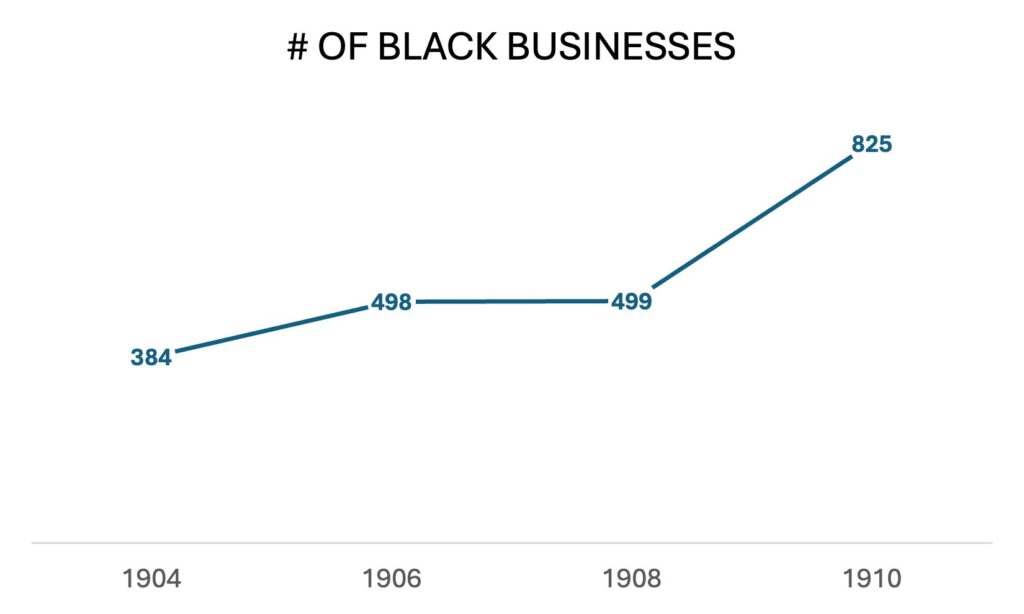
Third, the data show an increase in the number of Black businesses over the time in question. Figure 6 shows the overall number of Black businesses listed in the business directory per year. A plateau occurs between 1906 and 1908, the time periods surrounding the massacre. However, by 1910, the growth of Black businesses was evident. Again, it has been stated that a multitude of Black people left Atlanta in the immediate aftermath of the massacre.18 According to these data, those people either returned to the city or were replaced by newcomers. But the overall effect of the massacre on the number of Black businesses was short-lived.
Figure 6. Number of Black Businesses in City Directory
Fourth, to measure the movement of businesses after the massacre, the author created eight distinct areas on the maps. This spatial partitioning of the central city allowed for an examination of how the geography of Black business changed during the period of study.
These areas were not meant to correspond exactly to neighborhoods for two reasons. One, exact boundaries of neighborhoods were difficult to find in the historical record. Most records assumed knowledge of the boundaries. Two, even if a definition were found, the size of the neighborhoods was so small that the number of areas used for comparison would have been quite large. For example, Eugene Mitchell defined Darktown as “a densely populated colored district along Butler Street and Piedmont Avenue from Houston to Baker Street.”19 That neighborhood would compose 3 city blocks in total. The arbitrariness of the author’s area boundaries is a limitation of this study and is certainly subject to discussion.
The author strove not to describe areas as purely Black or white neighborhoods. As ably described by LeeAnn Lands in her book The Culture of Property: Race, Class, and Housing Landscapes in Atlanta, 1880-1950, Atlanta was not fully segregated at this time.20 Many neighborhoods contained a mixture of white and Black residents. So, this paper describes areas that contain predominantly Black neighborhoods, but precise racial boundaries were not assumed.
The boundaries of the Central Business District were drawn to ensure that most of all listed incidents on the night of September 22, 1906, were included. The only exceptions were three incidents that occurred along Peters Street. At one point, the mob made an aborted attempt to move to Pittsburgh, an all-Black neighborhood southwest of the central business district. After going a short distance, attacking Mattie Adams’ lunchroom, and ransacking a hardware store for weapons, the mob turned back, returning to the center of town, killing a Black worker on the return journey.21 This first night was the night of horror, with a rampaging mob and random attacks on all Black people. It was therefore the focus of this study and the impact on Black businesses. The next two days involved local authorities and their responses to the Black communities. Aborted forays were made into Black neighborhoods but met resistance.22
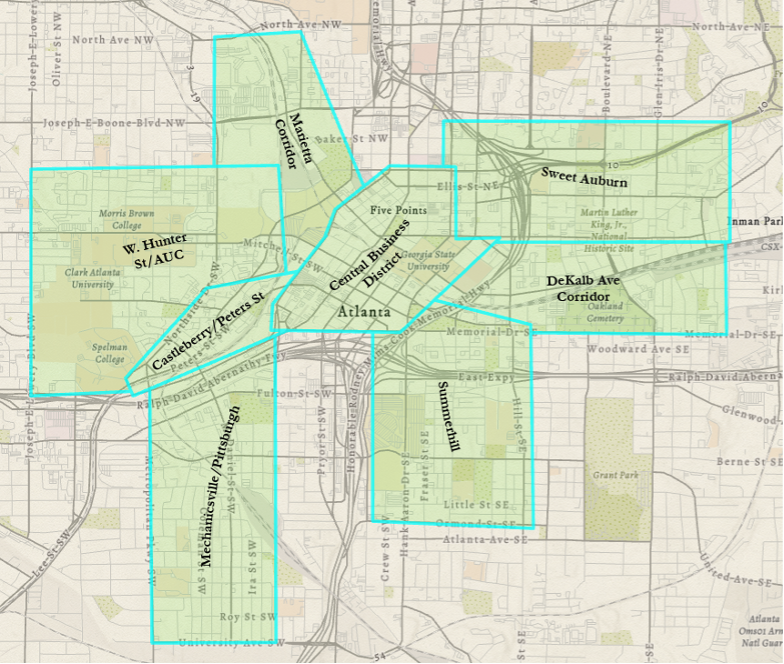
Figure 7. Boundaries of Atlanta Areas for Analysis
The eight distinct areas are described here (with boundaries using current street names) and shown in Figure 7 (the streets are approximate, not precise boundaries).
The Central Business District centered around Five Points, the center of Atlanta where five streets come together. It was the central business area for the white community. Many of the city’s biggest businesses (and even the governor’s mansion) were located within a few blocks of Five Points. This district would also include the State Capitol and the railroad depots. This area was the heart of the massacre. Using current street names, the author bounded the area by Andrew Young Boulevard on the north, Courtland Street, Edgewood Avenue, and Jesse Hill Jr. Drive on the east, Memorial Drive on the south, and Ted Turner Drive on the west.
Sweet Auburn contained Auburn Avenue but was bounded by Edgewood on the south, Courtland on the west, Ralph McGill Boulevard on the north, and Waddell Street and Lake Avenue on the east. This district also included the Black neighborhoods of Darktown, Buttermilk Bottom, and Shermantown.
Summerhill contained the Fraser Street business district. The author bounded it by Memorial Drive, Jesse Hill Jr. Drive, and Martin Luther King Jr. Drive on the north, Broyles Street on the east, Ormond Street on the south, and Pollard Boulevard on the west.
Castleberry/Peters Street contained the predominantly Black neighborhoods along the Peters Street corridor adjacent to the railroad. It connects with the Central Business District at Ted Turner Drive and is bounded by Northside Drive to the north, Whitehall Street to the south, and Chapel Street to the west.
West Hunter Street/Atlanta University Center (AUC) contained the business district that included Atlanta University, Morehouse College (then known as Atlanta Baptist College), and Spelman College (then known as Spelman Seminary). (Morris Brown College and Clark College were not located in that area at that time.) West Hunter Street was one of the most prominent Black business districts to develop in Atlanta besides Auburn Avenue. West Hunter Street today is known as Martin Luther King Jr. Drive. To the east this neighborhood was bounded by the Norfolk Southern railroads, Nelson Street, and Northside Drive. It was bounded by Park Street to the south, Joseph E. Lowery Boulevard to the west, and Spencer Street to the north.
The Marietta Corridor contained the business district surrounding Marietta Street once it left the Central Business District westward at Ted Turner Drive. It was bounded by the Norfolk Southern Railroad and Northside Drive on the west and North Avenue on the north.
Mechanicsville/Pittsburgh contained the predominantly Black neighborhood of Pittsburgh. Mechanicsville was more integrated and consisted mainly of workers from the railroads. Pittsburgh was the intended target of the white mob on Saturday night’s violence, but the mob never progressed that far before deciding to turn back. This area was bounded by Whitehall Street to the north, Metropolitan Avenue to the west, University Avenue to the south, and Windsor Street to the east.
The DeKalb Avenue Corridor contained the Decatur Street business district once it left the Central Business District on the eastward side at Jesse Hill Jr. Drive. It was bounded by Jesse Hill Jr. Drive on the west, Edgewood Avenue on the north, Memorial Drive on the south, and Pearl Street on the east.
Tables 2 and 3 illustrate the percentage and number of Black businesses located in each distinct area.
Table 2. Percentage of Listed Black Businesses in Each Neighborhood
1904
1906
1908
1910
Central Business District
35%
28%
24%
22%
Sweet Auburn
20%
23%
25%
22%
Summerhill
9%
8%
9%
7%
Castleberry/Peters Street
8%
7%
10%
7%
West Hunter/AUC
9%
11%
11%
14%
Marietta Corridor
7%
7%
5%
4%
Mechanicsville/Pittsburgh
5%
5%
4%
7%
DeKalb Corridor
4%
6%
7%
7%
Subtotal
97%
95%
95%
89%
Table 3. Number of Listed Black Businesses in Each Neighborhood
1904
1906
1908
1910
% Change
Central Business District
134
140
118
179
34%
Sweet Auburn
76
115
123
184
142%
Summerhill
34
41
46
56
65%
Castleberry/Peters Street
31
36
50
61
97%
West Hunter/AUC
33
55
54
113
242%
Marietta Corridor
27
33
26
29
7%
Mechanicsville/Pittsburgh
19
23
21
55
189%
DeKalb Corridor
17
29
35
55
224%
Subtotal
371
472
473
732
97%
The Central Business District shows a marked decrease in the proportion of businesses located within its borders. With this dataset, we cannot estimate how much of this decrease can be attributed to the 1906 massacre. But we can see that it is a continuation of a trend that is already evident between 1904 and 1906. In addition, the raw number of Black businesses in the Central Business District increased significantly by 1910. The 1908 directory shows a temporary dip but a recovery by 1910. The drop in the percentage of Black businesses in this area could have been driven by the overall dispersion across the city as it grows, with the opening up of new areas of development and residences.23 Notably, while 97 percent of all Black businesses were in these eight areas in 1904, only 89 percent were in 1910, reflecting this expansion of Atlanta as many new businesses were being created in the new additions to the city. We can be clear, though, that no hollowing out of the Black presence in the Central Business District is seen in the years immediately following the massacre.
The data show the Sweet Auburn area had a marked increase in the number of Black businesses within its borders. But this appears to have been the result of overall growth of Black businesses in the city, as every neighborhood shows growth during this time. A huge clustering of Black businesses in Sweet Auburn does not appear, as the percentage of all Black businesses in this area remained steady between 20 percent and 25 percent over the six years. Looking only at businesses with an address on Auburn Avenue, we see a growth from 24 businesses in 1904 to 61 in 1910, for a 154 percent increase. Given that the overall number of Black businesses in the directories grew from 384 to 825 (a 115 percent increase), we do see larger percentage growth on the street itself.
Clearly, the areas containing larger Black business neighborhoods were growing at a faster rate than the city as a whole. Looking at the last column of Table 3, which presents the growth from 1904 to 1910, Atlanta had 97 percent more Black businesses at the end of the decade. The fastest growing areas contained the Black neighborhoods of West Hunter Street/AUC and the DeKalb Corridor (located in the Fourth Ward adjacent to the Sweet Auburn neighborhood). The area designated as Sweet Auburn was also growing faster than the overall city. In this analysis, the Central Business District was one of the slowest areas in terms of Black business growth. This could be true for one of two reasons. One, newer Black businesses moved to the Black neighborhoods in the aftermath of the massacre (although it appears the established downtown Black businesses stayed there). Two, the Central Business District was already built out, so there was less room for expansion than in the newer neighborhoods along the edges of the city.
As noted earlier, the presence of Black grocers helps us distinguish between the areas that were primarily business neighborhoods geared to serving the white population and the ones that served Black residential customers nearby. Table 4 shows the top three business types per neighborhood per year, with grocers highlighted in bold.
Table 4. Top Three Business Types in Each Neighborhood
1904
1906
1908
1910
Central Business District
Lunch Rooms
Barber
Clothing Reno/Tailor
Lunch Rooms
Barber
Clothing Reno/Tailor
Lunch Rooms
Barber
Clothing Reno/Tailor
Barber
Lunch Rooms
Clothing Reno/Tailor
Sweet Auburn
Grocers
Lunch Rooms
Shoemakers
Grocers
Lunch Rooms
Coal and Wood
Grocers
Lunch Rooms
Shoemakers
Lunch Rooms
Grocers
Clothing Reno/Tailor
Summerhill
Grocers
Coal and Wood
Shoemakers
Grocers
Shoemakers
Coal and Wood
Grocers
Coal and Wood
Shoemakers
Grocers
Lunch Rooms
Shoemakers
Castleberry/Peters Street
Lunch Rooms
Barber
Shoemakers
Lunch Rooms
Barber
Shoemakers
Lunch Rooms
Barber
Shoemakers
Lunch Rooms
Shoemakers
Barbers
West Hunter/AUC
Grocers
Lunch Rooms
Shoemakers
Grocers
Coal and Wood
Lunch Rooms
Grocers
Shoemakers
Physicians
Grocers
Lunch Rooms
Shoemakers
Marietta Corridor
Lunch Rooms
Shoemakers
Barber
Lunch Rooms
Shoemakers
Barber
Lunch Rooms
Barber
Grocers
Lunch Rooms
Barber
Shoemakers
Mechanicsville/Pittsburgh
Shoe Makers
Barbers
Grocers
Grocers
Shoemakers
Lunch Rooms
Grocers
Candy, Soda
Barber/Coal and Wood
Grocers
Lunch Rooms
Shoemakers
DeKalb Corridor
Lunch Rooms
Barber
Blacksmith
Lunch Rooms
Grocers
Barber
Lunch Rooms
Barber
Shoemakers
Lunch Rooms
Barber
Shoemakers
Analyzing this table, four of the eight areas were more geared toward Black residential customers (Sweet Auburn, Summerhill, West Hunter Street/AUC, and Mechanicsville/Pittsburgh). The other four areas would have been more integrated, with Black businesses serving a more integrated clientele. The Central Business District had no grocers at all, and it is most likely the businesses there catered almost exclusively to white customers. As racial segregation grew during the Jim Crow era, it is not surprising then that areas with the most prominent Black business neighborhoods would be two of the four that catered more to Black residents. The lack of change across the four years among the most prevalent business types is also striking and supports the contention that we do not see a mass migration of Black businesses in the years immediately after the race massacre.
Discussion and Conclusion
A common conclusion from research into the effects of the 1906 Atlanta Race Massacre is that this horrific event hastened the creation of the thriving Black business neighborhoods of Sweet Auburn and the West Hunter Street/AUC. However, the data in this paper show that this effect did not occur immediately but a few years later. The data gathered from the Atlanta city directories do not show a hollowing out of the Central Business District where the atrocities of the massacre occurred, nor does it show a marked increase in businesses in the Sweet Auburn area compared with the rest of the city. The data does show that the growth rate of Black businesses in these areas with Black neighborhoods far outpaced the overall growth rate of Black businesses in the city. This could be a result of the fear engendered by the massacre but also could be attributed to the simple availability of space in areas not yet built out
Burns stated that Black businesses affected by the events closed and moved to safer areas.24 However, again the data does not bear this out. Mattie Adams is an illustrative example of this. Though she and her family were attacked, and the business looted, records show that she was still in the same location in 1908 and 1910. She appears to have died in 1912 (property from her estate was sold). The data do not show a significant amount of movement in the immediate aftermath of these events.
However, we do know from history that Auburn Avenue was a significant Black business neighborhood in the 1920s. So, what did occur? It appears that most of this coalescing and growth occurred between 1910 and 1920. Three reasons might account for this and should be the subject of future work. One, Atlanta did not begin to create segregated, legal zoning until this time. Starting in 1910, the Atlanta City Council passed an ordinance requiring all restaurants to be for one race.25 By 1910, 72 percent of all lunch rooms (191) were operated by Black individuals (137), which may have created the impetus for this ordinance—reducing economic competition for the white businesses.26 Atlanta was the first city in the state to seek residential segregation by law in 1913.27 Gino Nuzzolillo gives a good account of how these legal residential segregation attempts affected the Fourth Ward neighborhood surrounding Sweet Auburn.28
Two, the Great Atlanta Fire of 1917 on May 21 of that year ravaged the neighborhoods included in the Sweet Auburn area as described in this paper. Three hundred acres were burned, 1900 structures destroyed, and 10,000 people were displaced.29 Atlanta’s white residents tried to use the aftermath of this fire to create a park-like barrier to separate the races and further segregation while maintaining a white residential presence downtown.30 In actuality, many white people used this occasion to relocate to other areas farther up Peachtree Street or in Druid Hills.31 The backfill then became Black people, which increased the residential density in this area, providing even more of a base for a Black business neighborhood. In addition, many residential areas became commercial at this point, providing more room for Black businesses.
Three, and finally, the decade between 1910 and 1920 saw the beginnings of the first large-scale Black businesses in Atlanta. Heman Perry started Standard Life Insurance in 1913 and within a decade was employing almost 2500 Black people.32 In addition, his associated Service Industries started a Black bank, pharmacy, printer, and dry cleaner, among other businesses. At the same time, Alonzo Herndon was growing Atlanta Life Insurance, and it was becoming his main business, rather than his barber shops. Both businesses were located on Auburn Avenue. The sheer scale of these businesses would provide more employment for Black residents, bringing more of them into the Black neighborhoods and therefore offering greater opportunity for Black businesses to support them. Perhaps, then, what is to be noted is not the number of businesses but the type and size as well as where they were located. In the context of this research, Standard Life, which would employ hundreds would still only be one entry in the city directory, given the same weight as a simple lunch room. Therefore, a future study might consider the economic impact of different types of businesses as opposed to treating them as essentially equal.
Another benefit of this research is showing the value of using city directories, particularly if they can be converted into databases, and applying data mining and other techniques. A continuation of this research should utilize the details listed in the residential and street directories of the overall city directories. A quick analysis of the 1908 Atlanta City Directory showed more than 42,000 residential addresses (containing the lowercase r), approximately 6600 of which were homes of Black people. The creation of a database of this information would include more informal labor among Black residents (as more than two thousand were listed as laborers) and could show more regarding residential patterns. One major disadvantage is that women were ignored unless they were the head of a household, and with the refusal to grant the titles of ‘Mrs.’ and ‘Miss’ to Black women, no accuracy can be guaranteed separating out the genders. So Black entrepreneurs such as laundresses could still be excluded. Census data include more people, and employment data could be tracked there. However, census data are only decennial, while city directories were annual. The city directories, therefore, can give a more granular look at the city, even with the data limitations.
This database can also be used as a foundational look at Atlanta’s Black community. For those businesses that were still in operation after six years, do those businesses remain viable in the Black community? Or were they hindered by the types of businesses (food, service, etc.) that tend not to be long-lived? If the businesses did not last (and most show up only one time), did the wealth remain in the community, and can that be tracked through a combination of city directories and census data?
In conclusion, what the data does show is the overall perseverance of the Black business community in Atlanta. After the horrific events of the massacre, the community did not fold or disappear but continued to grow. Many of the original businesspeople in the Central Business District stood their ground and remained even after the violence of that night. The memories of the defiance of Black neighborhoods led to growth in those areas also. Within three years after the massacre, the size, number, and diversity of the Black businesses present in Atlanta were larger than ever and continued to grow. In addition, this data shows many Black people using entrepreneurship as a means of independence and autonomy when most were forced into the role of laborer. Even the large number of businesses that only showed up briefly, before moving or disappearing, demonstrate this constant striving for a place in this hostile economy.
And finally, what about Mattie Adams? Mrs. Adams is one of the few Black victims named by contemporary sources at the time of the massacre. Far too many were never noted in the historical record. She did see some sense of justice: George Blackstock was convicted for assault with intent to murder, and given a fine of $300 (approx. $10,000 in 2024) or a year in prison.33 While this seems ridiculously low, note that no rioter was ever convicted of murder, despite all the killings over those few days. Mrs. Adams did testify against him in court, as did her daughter. As noted earlier, she appears to have remained in the same location until her death in 1912. Very few Black businesses in the city directories last for more than a year or two, but she maintained her lunch room for a decade. For a woman born in slavery who could neither read nor write, her accomplishments epitomize the perseverance of many of Atlanta’s Black business people.
Keith Hollingsworth, PhD is a Professor of Business Administration at Morehouse College. During the 2022-23 academic year, he served as a Visiting Professor at Princeton University’s Keller Center while on sabbatical. At Morehouse, he teaches courses on Black Entrepreneurial History, Data Analytics and Modeling, and Production/Operations Management. Keith received his B.S., M.S., and Ph.D. in Industrial Engineering from Georgia Tech in 1990, 1992 and 1995 respectively. Dr. Hollingsworth has taught at Morehouse for 31 years. His research interests are Black Business History and Student Development. His articles have appeared in Accounting Historians Journal, Journal of Management History,Challenge, and Enterprise and Society. He is a first-generation college graduate, a native Georgian and an active member at All Saints Episcopal Church.
“In the Courts,” Atlanta Constitution, November 1, 1906, 6.↩
Ray Stannard Baker, Following the Colour Line: American Negro Citizenship in the Progressive Era (New York: Doubleday, Page & Company, 1908), 17.↩
Keith Hollingsworth, “The 1906 Atlanta Race Riot Aftermath: CSR in Action and Woke-washing.” Enterprise & Society 25, no. 2 (2024): 313-328.↩
The Auburn Avenue area was designated as ‘Sweet Auburn’ by John Wesley Dobbs in the 1930s. Though the title would not have been in use at the time of the massacre, it is used in this paper to denote this historical neighborhood. See Pomerantz (1996, 124). West Hunter Street is now Martin Luther King Jr. Drive.↩
Rebecca Burns, Rage in the Gate City: The Story of the 1906 Atlanta Race Riot (Cincinnati: Emmis Books, 2006) 159, 18; Gregory Mixon, The Atlanta Riot: Race, Class, and Violence in a New South City (Gainesville: University Press of Florida, 2005), 105, 107-108, 126; Gary M. Pomerantz, Where Peachtree Meets Sweet Auburn: The Saga of Two Families and the Making of Atlanta (New York: Simon & Schuster, 1996), 76.↩
Mixon, quoting J. Max Barber, suggested more than five thousand (Mixon, 2005, 122); Rebecca Burns, Rage in the Gate City: The Story of the 1906 Atlanta Race Riot (Cincinnati: Emmis Books, 2006), 175.↩
W. E. B. Du Bois, ed., The Negro in Business: Report of a Social Study Made under the Direction of Atlanta University, Together with the Proceedings of the Fourth Conference for the Study of the Negro Problems, Held at Atlanta University, May 30–31, 1899, No. 4 (Atlanta: Atlanta University, 1899), 8-9. Atlanta City Directory (1904), 1265–1354.↩
It was not uncommon for a business to show up under multiple classifications, e.g., the printer Foote & Davies showed up seven times in the business directory, including listings under Book Binders, Office Supplies, and Printers.↩
John N. Ingham, “Building Businesses, Creating Communities: Residential Segregation and the Growth of African American Business in Southern Cities, 1880–1915,” Business History Review 77, no. 4 (2003): 643↩
Rebecca Burns, “The Second Burning of Atlanta,” Atlanta, February 16, 2017, 175.↩
Marvin Mitchell, “Queen Place Names in Old Atlanta,” The Atlanta Historical Bulletin 1, no. 5 (1931): 29.↩
LeeAnn Lands, The Culture of Property: Race, Class, and Housing Landscapes in Atlanta, 1880–1950 (Athens, GA: University of Georgia Press, 2009).↩
Rebecca Burns, Rage in the Gate City: The Story of the 1906 Atlanta Race Riot (Cincinnati: Emmis Books, 2006), 146-147; Gregory Mixon, The Atlanta Riot: Race, Class, and Violence in a New South City (Gainesville: University Press of Florida, 2005), 92-93.↩
John Dittmer, Black Georgia in the Progressive Era, 1900–1920 (Urbana: University of Illinois Press, 1980), 13; Lawrence Otis Graham, Our Kind of People: Inside America’s Black Upper Class (New York: HarperCollins, 1999), 336.↩
Giovanni Nuzzolillo, The Organized Community: Visions of the New South in Black Atlanta, 1880–1922 (Honors thesis, Duke University, 2020).↩