Citation: Humphries, Josh and Kendra Taylor. “Analyzing the relationship between major public investments and neighborhood change in Atlanta,” Atlanta Studies, August 12, 2021. https://doi.org/10.18737/atls20210811b
In the Neighborhood Change Report released by the City in February 2021, we explore how major public investment and design goals are related to changes in where low-income and non-low-income residents live in the city.1 At the center of discussions about neighborhood change is what happens to low-income residents when neighborhoods are transformed by substantial public investment, land-use practices, and demographic change. Focusing the discussion on low-income residents is important because they are at the most risk for displacement when housing becomes more expensive in neighborhoods. While gentrification and displacement are at the forefront of many advocacy and policy discussions about neighborhood change, there are several different types of neighborhood change that warrant study and policy attention.
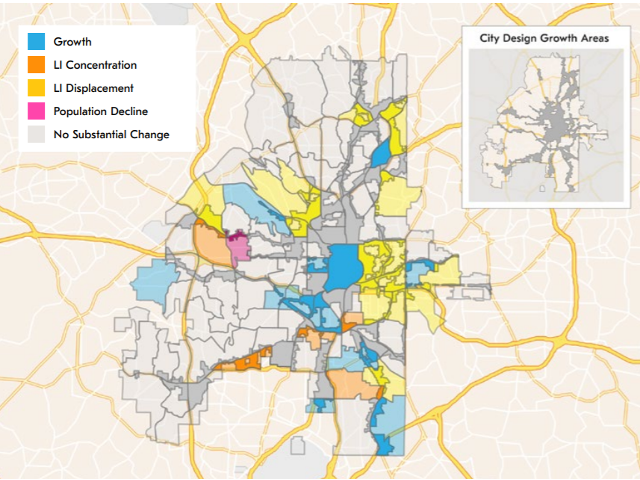
At the City of Atlanta, we are interested in different types of neighborhood change and how that change impacts the residents of the city. For example, concentrated poverty is a long-standing problem facing cities like Atlanta because spatially concentrated poverty is related to poor health outcomes, lack of access to high-quality public institutions like schools, and barriers to building wealth and economic opportunity.2 Additionally, from a policy standpoint, it is important to identify neighborhoods where there has been a growth in population, including of more affluent residents, without displacement of low-income (LI) residents. These are neighborhoods where there is often racial and economic diversity. Maintaining the possibility of growth without displacement in these neighborhoods is critical. We are particularly interested in the ways that change may be related to the design of Atlanta and the city’s land-use policies and practices. When Atlanta released its long-term planning guide, The Atlanta City Design, adopted into the City’s charter in 2017, it introduced the concept of categorizing land in the city as either ‘Growth Areas’ (including Production Areas, Clusters, Core, and Corridors) or ‘Conservation Areas’. ‘Growth Areas’ are higher density corridors throughout the city that are characterized by transit access, higher levels of commercial activity, and increased opportunities for residential access (see Figure 1). ‘Conservation Areas’ feature extensive tree canopy and lower-intensity residential and commercial usage.
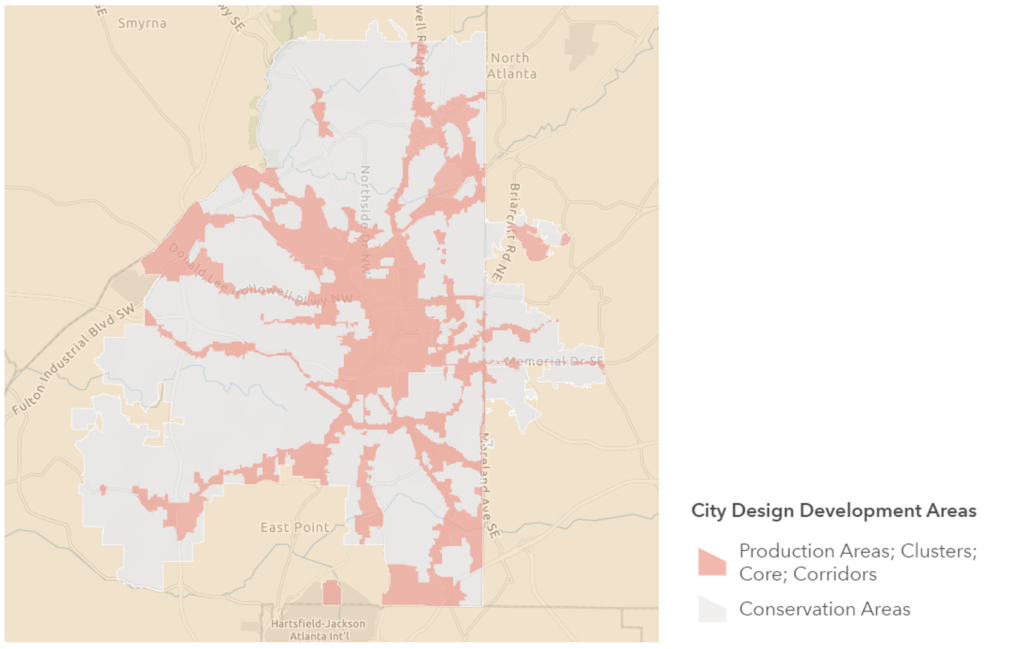
These categorizations are based on a combination of the areas’ historic development patterns and are used as a basis for guiding the city’s growth over the next several decades. The intersection of neighborhood change and land-use policies are important for the City to monitor as the population of Atlanta grows and the City seeks to enact policies that ensure equitable growth.
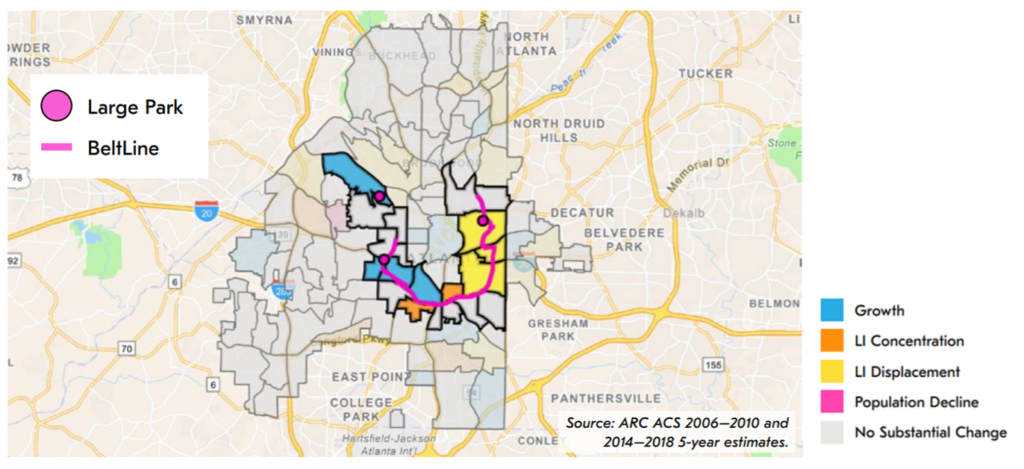
To measure neighborhood demographic change, we used a typology from the Institute on Metropolitan Opportunity and data from the American Community Survey (ACS). We classified changing neighborhoods as either Growth, LI Displacement, LI Concentration, and Population Decline based on their changing composition of LI and non-low-income (NLI) residents.3 To measure change over time, we used ACS 5-year estimates that were allocated by the Atlanta Regional Commission to Atlanta’s Neighborhood Statistical Areas.4 We measured change in the absolute number of LI and NLI residents from 2010 to 2018, as well as the change in the share of LI residents in a neighborhood. The typology that emerges from this approach includes four neighborhood types: Growth, LI Displacement, LI Concentration, and Population Decline based on thresholds of a 10 percent absolute change and 2 percentage point proportional change.5
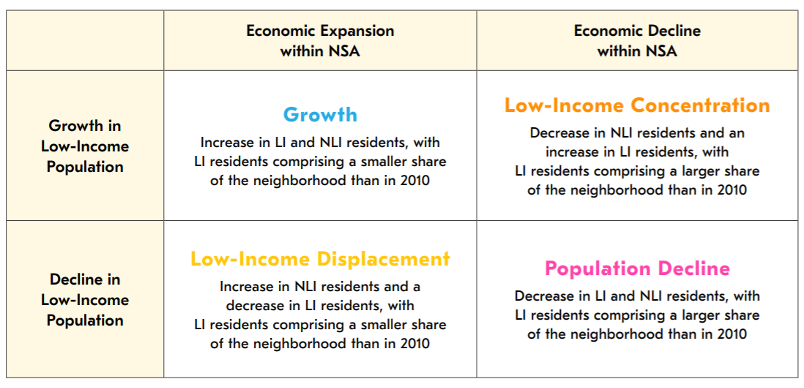
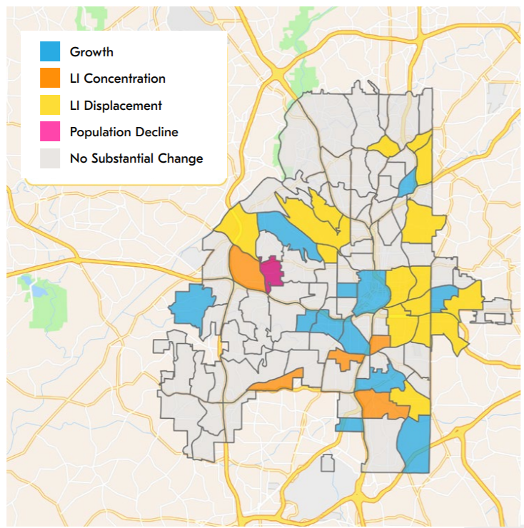
Atlanta is home to many low-income households, and the number of those households has grown in recent years. Although NLI residents increased by a larger amount from 2010 to 2018 (~18%), low-income residents also grew during this period (~10%). Given that the city has seen growth in both LI and NLI residents since 2010, we would expect that many neighborhoods saw growth in both resident populations. Of the neighborhoods that experienced substantial change between 2010 and 2018, the most common type of change was LI Displacement, followed by Growth, then LI Concentration, and Population Decline. It is important to note that most residents in Atlanta (~300,000) lived in a neighborhood that did not experience substantial change in the composition and growth/decline of their LI and NLI populations. In Atlanta, these changes disparately impacted different population subgroups. For example, Black residents increased in Growth and LI Concentration neighborhoods, while White residents increased in all neighborhood types, but saw the largest increases in Growth and LI Displacement neighborhoods. For more details on how neighborhood change was related to racial composition of neighborhoods, see the full report.
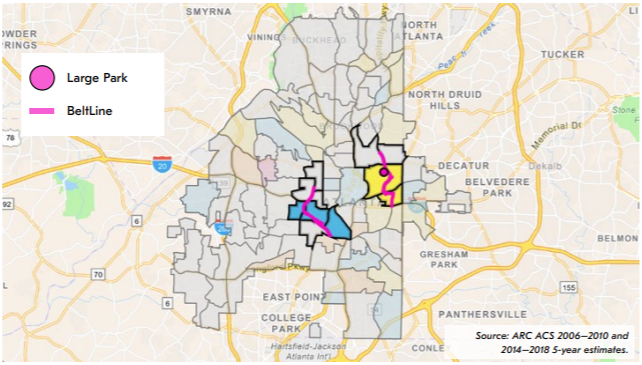
Several large public infrastructure projects completed since 2010 changed the physical nature of neighborhoods in Atlanta, specifically the completion of the Atlanta BeltLine’s Eastside and Westside Trails and the opening of Old Fourth Ward Park. Public investments like new parks can make neighborhoods more desirable, which in turn drives up housing costs and can fuel changes to the populations within neighborhoods.6 Indeed, in Atlanta we see that LI Displacement neighborhoods had the highest home sale prices in 2018 (Table 2). As housing prices rose, there was also an increase in rent-burdened households across neighborhood types, which is important to note as more low-income households rent than own their homes. The largest increases in rent-burdened residents were seen in LI Concentration and Population Decline neighborhoods where there were characteristics associated with economic decline (see Table 3).


We found that, on average, Growth and LI Displacement neighborhoods saw the most major public investments, while no substantial public investment has occurred in LI Concentration or Population Decline neighborhoods since 2010 (see Figure 3). However, future major public investment is expected in LI Concentration neighborhoods and neighborhoods that did not experience substantial change (see Figure 4 which shows future public investments). It will be important to consider the neighborhood context and policy interventions that support displacement mitigation near future public investment sites to ensure that the investments can benefit existing as well as new residents.
Single-family housing is the dominant land use pattern throughout most of the City Design Conservation Areas, and Population Decline and LI Concentration neighborhoods are, on average, comprised of a higher percentage of City Design Conservation Areas (see Figure 5). These neighborhoods have seen meaningful NLI population decline as a lack of economic growth has led to a concentration of LI residents and decline in residents across multiple income levels. In turn, the lack of higher density land-use in these neighborhoods may contribute to a lack of sufficient density to drive local resources. Exclusively single-family land-use may also make these neighborhoods vulnerable to rapid change because they lack the flexibility to accommodate significant growth through an increase in gentle density. In contrast, Growth and LI Displacement neighborhoods have, on average, a higher percent of City Design Growth Areas. City Design Growth Areas are typified by more varied land uses and a greater potential to accommodate density in development of all kinds under current policies. The relationship between the City Design Growth and Conservation Areas and neighborhood change broadly may indicate that more dense and varied housing stock is needed, particularly in areas proximate to private and public amenities in the City Design Growth Areas. Additionally, ways to increase gentle density in the City Design Conservation Areas are needed to ensure that housing supply can meet demand. In Atlanta City Design: Housing, the City is putting forward a policy agenda that includes getting rid of exclusionary single-family zoning and increasing density in the city. This policy agenda is consistent with existing research that shows the racially and economically exclusionary basis of single-family zoning, and that one of the most efficacious ways to reduce displacement is to increase the supply of housing.7
Atlanta has seen several different types of neighborhood change in recent years, with the most common types being LI Displacement and Growth. These differences means that while there are neighborhoods that have seen an increase in NLI residents accompanied by a decline in LI residents (LI Displacement), there are also neighborhoods where there was an increase in NLI residents without accompanying decline of LI residents (Growth). It is important to implement policies that support increased density and affordability to mitigate the low-income displacement that may occur in these neighborhoods that are experiencing growth. Additionally, several neighborhoods have seen LI concentration and may be at particular risk for the negative outcomes associated with concentrated poverty. The analysis also found evidence that neighborhood change was related to major public investment, with Growth and LI Displacement neighborhoods seeing major public investments while LI Concentration and Population Decline neighborhoods saw no major public investment And neighborhood change was also related to City Design Growth/Conservation Areas and their land-use practices, with LI Displacement and Growth neighborhoods having higher shares of City Design Growth Areas than LI Concentration or Population Decline neighborhoods. As Atlanta grows, the Neighborhood Change Report provides an analytical tool for capturing the multidimensional change and how City policies and practices are related to that change. To learn more, read the full report where we describe additional analyses and make policy recommendations to address negative externalities associated with neighborhood change.
Josh Humphries’ current role is as Director of Housing and Community Development for the City of Atlanta, where he leads a team that implements innovative programs and policy solutions to improve housing affordability and expand small business opportunities. From zoning reform to better use of public land for urban ag and affordable housing, the team looks for ways to positively impact the lives of Atlanta residents. Prior to joining the City of Atlanta, he worked to advance economic justice as a community organizer and community development leader in Los Angeles and New York City. Josh has a bachelor’s degree in philosophy from Kennesaw State University and a Master of Divinity in community organizing from Fuller Theological Seminary. Email Josh at jhumphries@atlantaga.gov.
Kendra Taylor is a Project Manager in the Office of Housing and Community Development and supports the work of the office by conducting analyses to support data-informed policymaking. She works with the team to develop research-based recommendations and policy approaches to address housing and community development challenges in Atlanta, and to evaluate the impacts of existing programs. She holds a PhD from Penn State where her research focused on the intersection of education and housing, and policies that create more equitable and diverse communities. Contact Kendra at keataylor@atlantaga.gov.